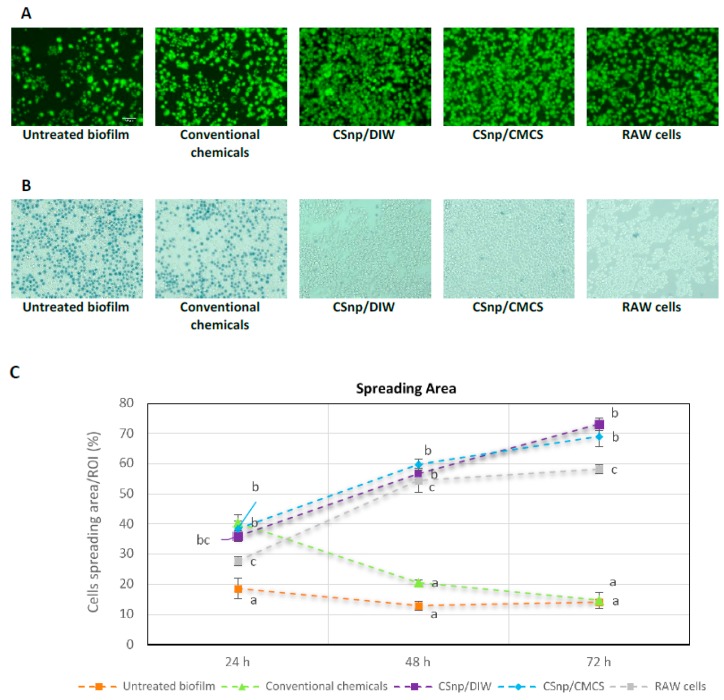
Figure 6.
(A) Fluorescent images of Calcein AM stained RAW264.7 macrophages showing relative viability of cells after 72 h of interaction, (20× magnification, scale bar = 50 μm). (B) Microscopic images showing trypan blue exclusion assay performed to check cells viability in different treatment groups. (C) Spreading area of live macrophages in regions of interest (ROI) in treatment groups showing highest percentage of spreading in both CSnp treated groups. Error bars represent standard error of the mean, different characters above bars indicate statistically significant difference between the groups at each time point (p < 0.01).

