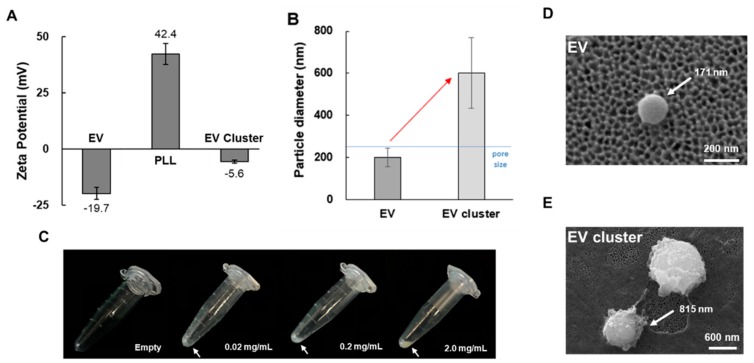
Figure 2.
Cluster formation of EVs in plasma sample. (A) Zeta potential of EVs isolated by UC and PLL solution (10 mg/mL), and EV cluster obtained from UC sample. (B) Particle diameter of pure EV obtained by UC and EV cluster. (C) Images of precipitated pellet formation with varying PLL concentrations (0–2.0 mg/mL) with plasma sample. Incubation time was fixed at 1 h. (D) SEM images of EV isolated by UC and (E) EV clusters.

