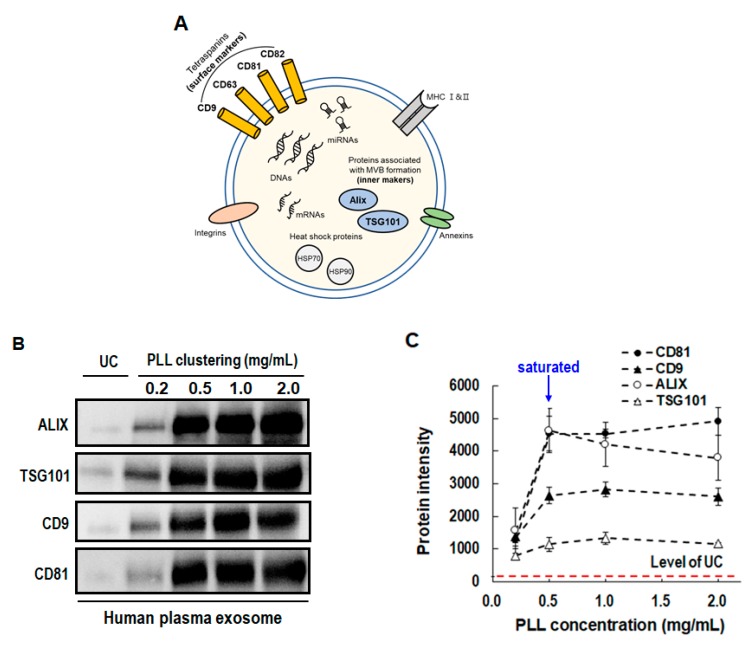
Figure 4.
Detection of EV surface protein markers (CD81 and CD9) and inner protein markers (ALIX and TSG101) according to PLL concentration (0.2–2.0 mg/mL). (A) Diagram of molecular composition in EVs. (B) Band images of Western blot assay. (C) Band intensity of four EV markers. (PLL: poly-l-lysine, GuTc: guanidium thiocyanate).

