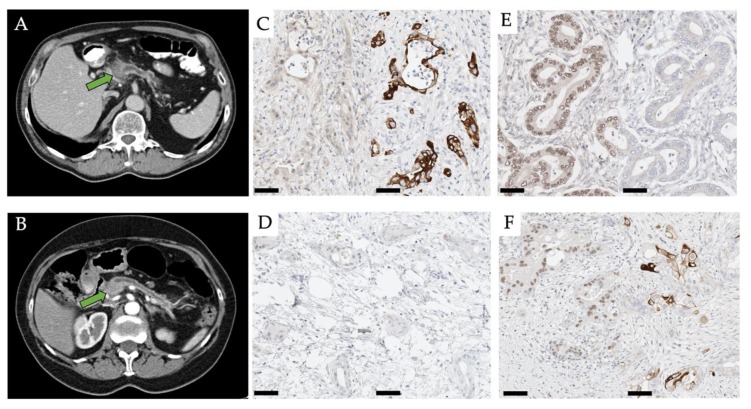
Figure 1.
CT images of a patient with a QM (A) and a non-QM (B) PDAC in the pancreatic head (arrow). Window level 36 Hounsfield-Unit width 350 Hounsfield-Unit in both cases. Micro-photographs of representative immunohistochemical specimens of a HNF1a-/KRT81+ (QM) tumor (C), a HNF1a-/KRT81- (non-QM) tumor (D), a HNF1a+/KRT81- (non-QM) tumor (E) and a HNF1a+/KRT81+ (unclassifiable) tumor (F). Scale bar 50 µm. HNF/KRT immunostainings left/right in each subfigure, respectively.

