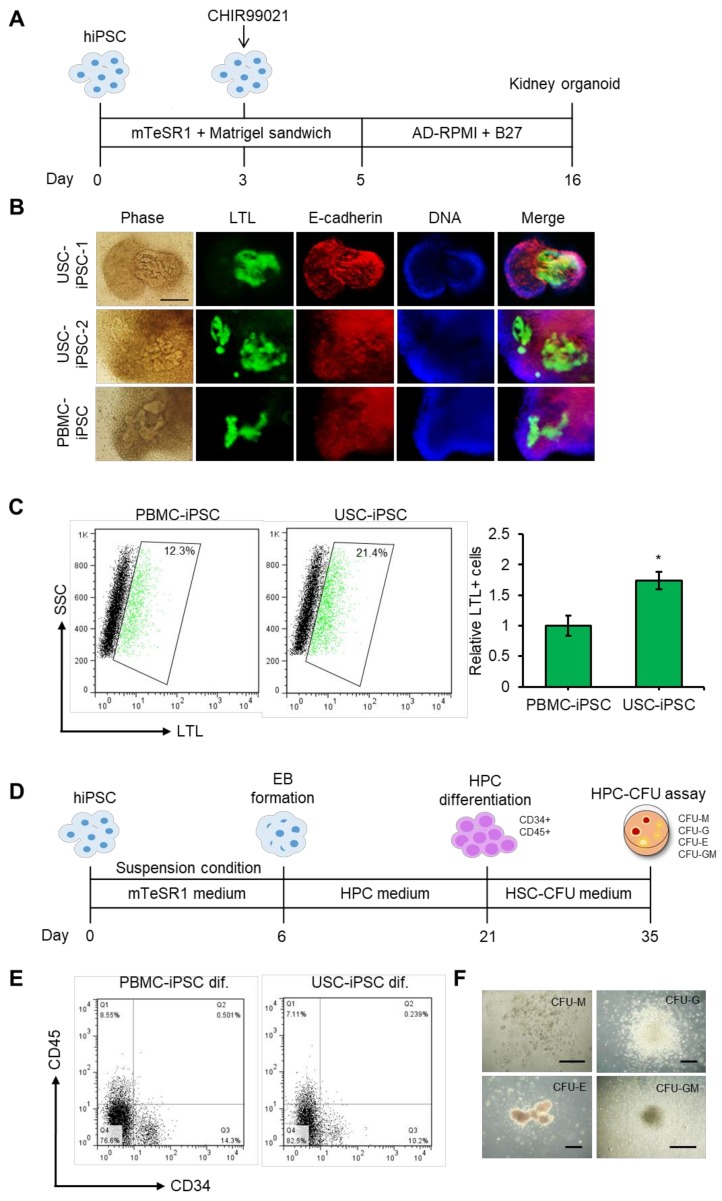
Figure 7.
Differentiation of USC-iPSCs. (A) Schematic representation of USC-hiPSC-derived kidney organoids. (B) Representative images showing changes in cell morphology and lotus tetragonolobus lectin (LTL) proximal tubule marker expression during 16 days of kidney organoid differentiation. Scale bar: 100 µm. (C) Flow cytometry analysis of LTL binding in PBMC-iPSC and USC-iPSC derived kidney organoids as a percentage of the total population. The data are presented as fold changes compared with the PBMC-iPSC. (D) Schematic representation of USC-iPSC derived HPCs. (E) Flow cytometry analysis of HPC markers of differentiated USC-iPSC derived HPCs. (F) Colony forming unit (CFU) analysis of USC-hiPSC derived HPCs. M, Megakaryocyte; G, Granulocyte; E, Erythroid. n = 3 biological samples. (* p < 0.05).

