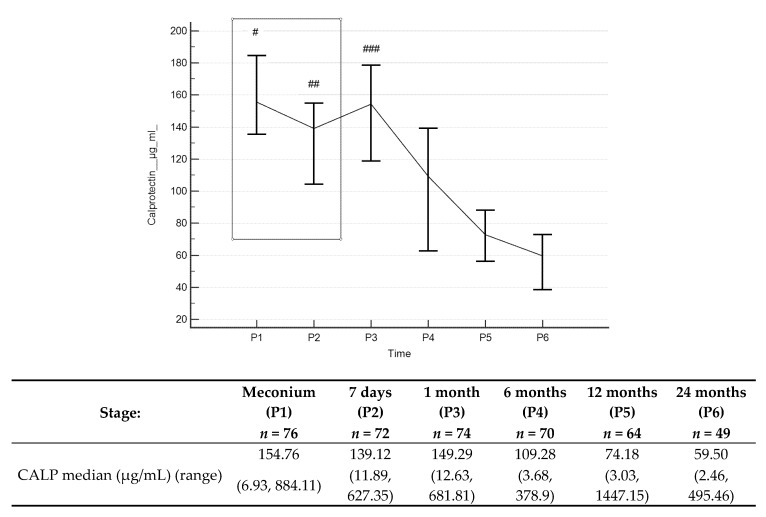
Figure 3.
Calprotectin (CALP) concentrations (median) over time. Legend: Error bars represent 95% confidence intervals for medians. For Kruskall–Wallis test p < 0.000001. Conover’s post-hoc analysis: # p < 0.05 P1 vs. P4, P5 and P6; ## p < 0.05 P2 vs. P4, P5 and P6; ### p < 0.05 P3 vs. P4, P5 and P6. For Wilcoxon paired tests comparing times: # p<0.05 P1 vs. P4, P5 and P6; ## p < 0.05 P2 vs. P5 and P6; ### p < 0.05 P3 vs. P4, P5 and P6. To better illustrate changes in CALP levels in the first two years of life, CALP levels in meconium, and stool from day 7, are marked with a box (these results were presented in our previous work [29]).

