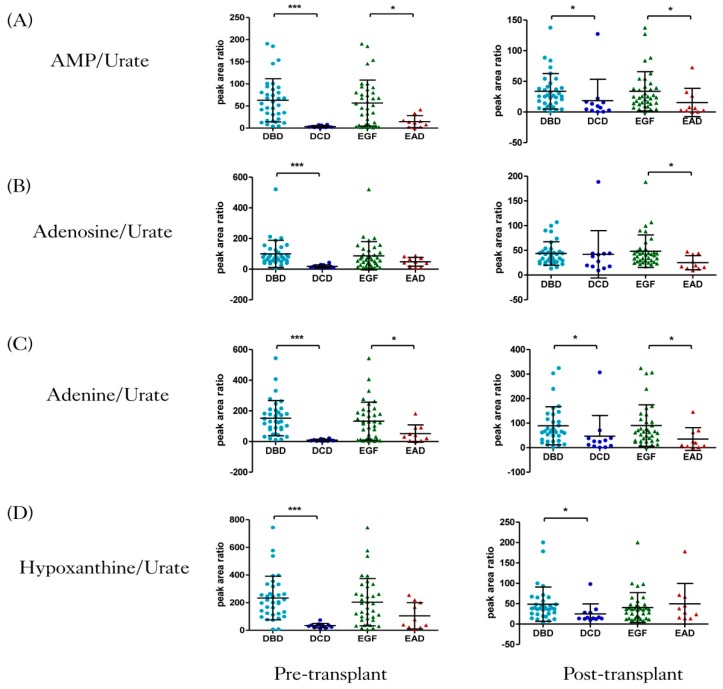
Figure 1.
Jittered scatter plots of four ratios of metabolites’ levels in four groups at two transplant stages. (A) Adenosine monophosphate (AMP)/urate, (B) adenosine/urate, (C) adenine/urate, and (D) hypoxanthine/urate. AMP, adenosine monophosphate. Results are presented as mean ± SD, p-value was derived from Mann–Whitney tests, followed by Benjamini–Hochberg false discovery rate (FDR) correction (* q < 0.05, *** q < 0.001). DBD, donation after brain death; DCD, donation after circulatory death; EGF, early graft function; EAD, early allograft dysfunction.

