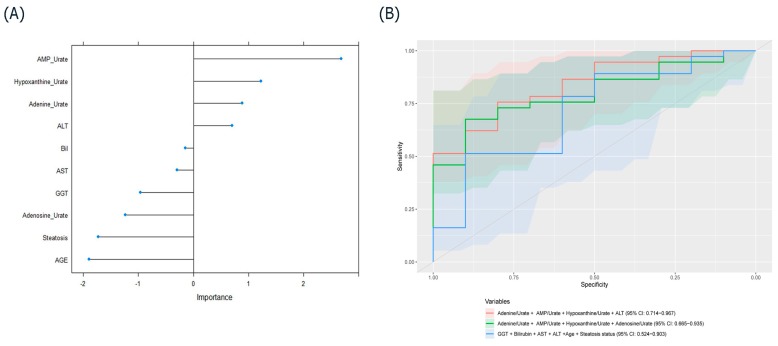
Figure 2.
(A) Variable-importance plot derived from the random forest model. (B) Receiver operating characteristic (ROC) curve prediction of EGF based on the highest areas under the curve (AUC) with the combination of either clinical variables or metabolite ratios and the combination of metabolites and clinical variables. ALT, alanine aminotransferase; BiL, bilirubin; AST, aspartate aminotransferase; GGT, gamma-glutamyl transferase.

