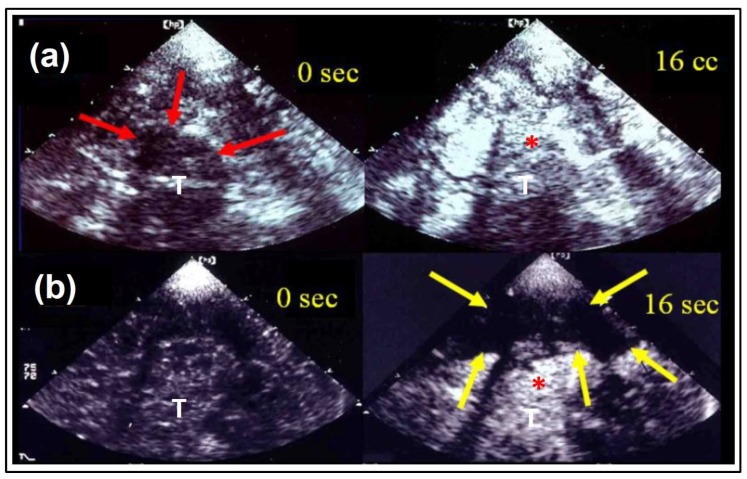
Figure 2.
Ultrasound perfusion imaging in the course of time. Early “unilateral” gray-scale imaging in a healthy volunteer (a) and an acute stroke patient (b) corresponding to Figure 1: at baseline (0 s) and after contrast enhancer application at the time of maximal contrast enhancement (16 s). The thalamic region (red arrows) is marked with increase of brightness in both examples (*), whereas the regions of the lentiform nucleus and temporoparietal lobe are spared (yellow arrows), where later infarction was demonstrated in CCT follow-up. (T) indicates the third ventricle, adapted from [15] with permission from Elsevier.

