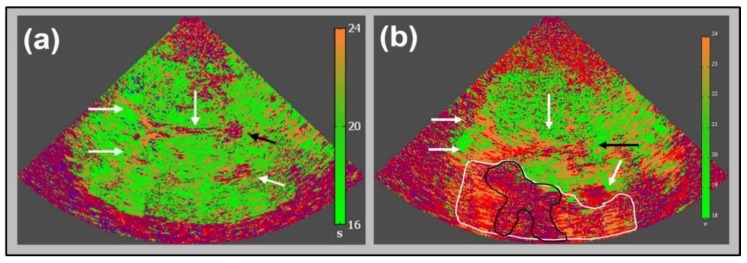
Figure 3.
Up to date “bilateral” perfusion imaging corresponding to Figure 1: parametric image of time-to-peak intensity (TPI) in a healthy volunteer (a) with homogeneously distributed greenish parts of parenchymal structures (TPI 16 to 20 s) and the depiction of frontal and posterior horns of side ventricles as well as third ventricle (white arrows), and pineal gland (black arrow), adapted from [12]. Note the near field artifact. TPI parameter image of an acute stroke patient 2.5 h after symptom onset (b) of a severe stroke caused by occlusion of the M1 segment of the middle cerebral artery. Note the core of infarction (pink area, surrounded by black line) and hypo-perfused nature, and potentially salvageable area (orange area, surrounded by white line) due to collateral flow; adapted from [12] with the publisher’s permission.

