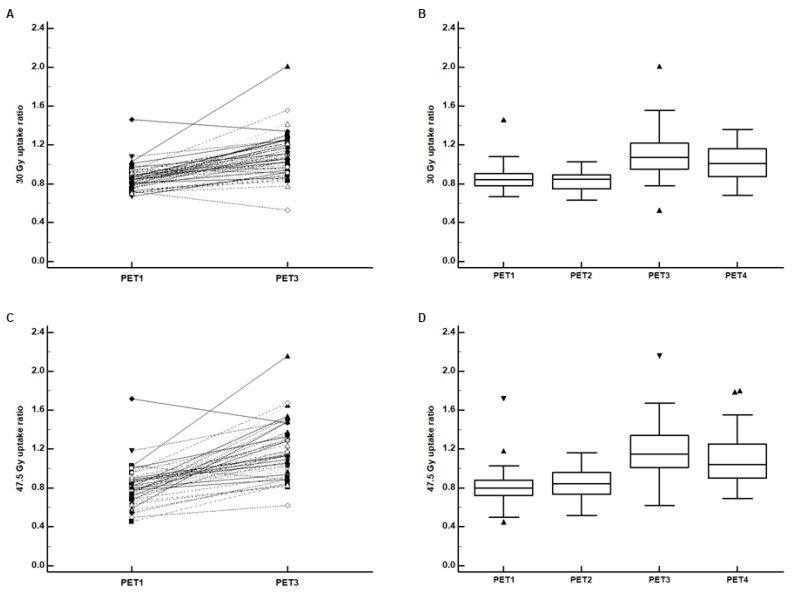
Figure 4.
(A) Pairwise comparison of the 30 Gy-irradiated myocardium-to-low-irradiated myocardium F-18 Fluorodeoxyglucose (FDG) uptake ratio (30 Gy uptake ratio) between positron emission tomography/computed tomography (PET/CT) for staging work-up (PET1) and PET/CT after the completion of the adjuvant radiotherapy (PET3) and (B) distributions of the 30 Gy uptake ratio on PET1 (n = 55), PET/CT after the completion of the adjuvant chemotherapy (PET2) (n = 29), PET3 (n = 55), and follow-up PET/CT for surveillance (PET4) (n = 37). (C) Pairwise comparison of the 47.5 Gy-irradiated myocardium-to-low-irradiated myocardium FDG uptake ratio (47.5 Gy uptake ratio) between PET1 and PET3 and (D) distributions of the 47.5 Gy uptake ratio on PET1 (n = 47), PET2 (n = 24), PET3 (n = 47), and PET4 (n = 30). (Central box, the values from the 25 percentile to 75 percentile; middle line in the box, median value; error bar, extending from the minimum value to the maximum value except outside values; marker, an outside value which is smaller than 25 percentile minus 1.5 times the interquartile range or larger than the 75 percentile value plus 1.5 times the interquartile range).

