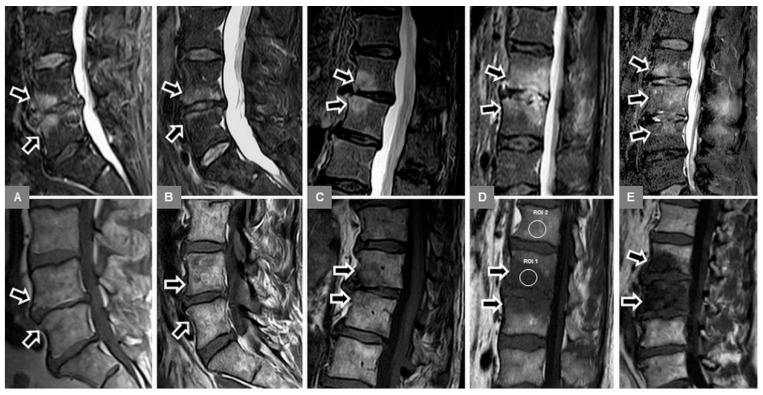
Figure 4.
Visual assessment of the T1-w signal (bottom row of sagittal T1-w images, arrows), corresponding to the bone marrow edema (top row of sagittal STIR images, arrows), compared to normal bone marrow, in different patients with MT1 or spondylodiscitis. (A) A 53-year-old female patient with Modic type 1 and a hyperintense T1-signal at L4/5. This signal hyperintensity is explained by the overlap of bone marrow edema and fatty marrow conversion, thus additional Modic type 2 changes. (B) A 53-year-old female patient with Modic type 1 and isointense T1-signal at L4/5. (C) A 78-year-old female patient with Modic type 1 and mixed hyper-/hypointense T1-signal at Th12/L1. (D) A 63-year-old male patient with early spondylodiscitis and hypointense T1-signal (equal to the musculature) at L2/3. The region of interest (ROI) (1) at L2 exemplifies the measurement of the T1-signal intensity within the bone marrow edema area, and the ROI (2) within the adjacent unaffected vertebral body at L1. (E) A 66-year-old male patient with early spondylodiscitis and marked hypointense T1-signal (more hypointense than the musculature) at L2/3.

