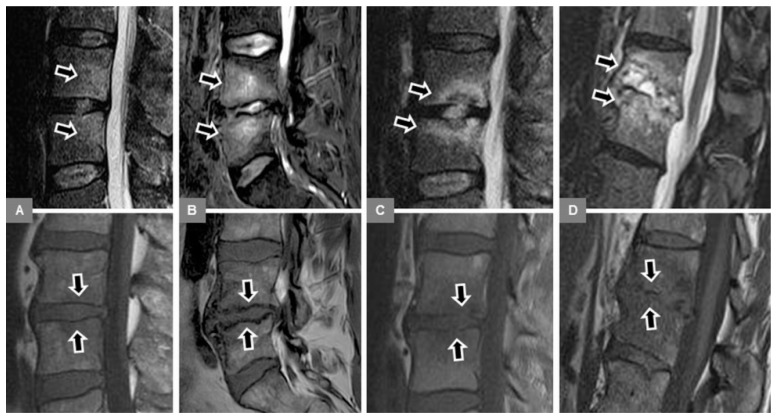
Figure 5.
Evaluation of the vertebral endplate contour (bottom row of unenhanced sagittal T1-w images, arrows) in different patients with vertebral bone marrow edema (top row of sagittal STIR images, arrows), resulting from MT1 or spondylodiscitis. (A) A 54-year-old male patient with early spondylodiscitis and normal endplates at L3/4. (B) A 53-year-old male patient with Modic type 1 and irregular, but intact endplates and marked T1-w hypointense bony sclerosis, representing additional Modic type 3 changes at L4/5. (C) A 55-year-old male patient with early spondylodiscitis and blurred, discontinuous endplates at L3/4. (D) A 63-year-old male patient with advanced spondylodiscitis and endplate destruction with height decrease at Th12/L1.

