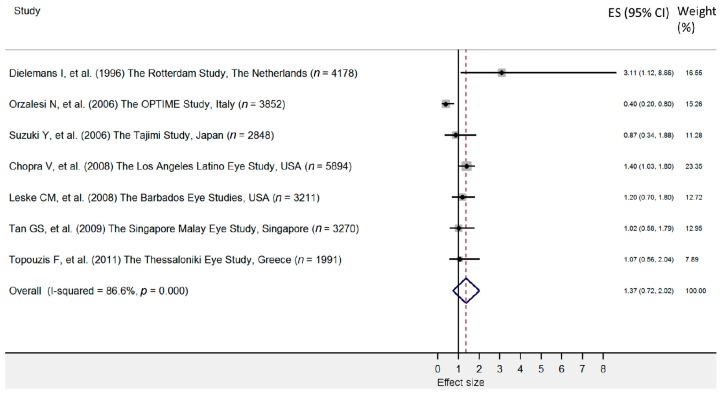
Figure 3.
Forest plot of cohort studies that evaluated diabetes as a risk factor for primary open angle glaucoma. The effect size (square, with size proportional to weights used) and 95% confidence intervals (horizontal lines) is presented for each study. The overall measure revealed by pooled analysis is marked with the center of the diamond, while the associated confidence intervals are marked by lateral tips of diamond [31,32,34,42,46,49,51].

