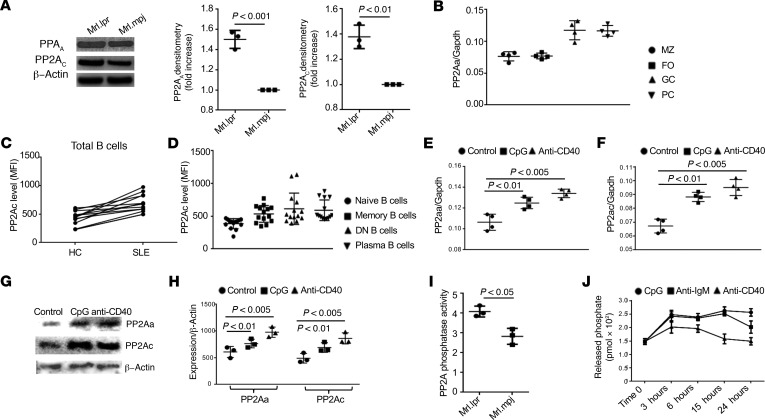
Figure 1. Increased PP2A expression and enhanced function in activated B cells or B cells from lupus-prone mice and SLE patients.
(A) Western blot analysis on the expression of both scaffold (PP2AA) and catalytic (PP2AC) subunits in splenic B cells isolated from the indicated mice. Quantification of Western blots (n = 3 per experiment, a representative experiment and pooled densitometry of the 3 experiments are shown). (B) Germinal center B cells (GC, CD19+FAS+GL7+), plasma cells (PC, CD19+IgG+CD138hi), marginal zone B cells (MZ, CD19+CD21+CD23lo), and follicular B cells (FO, CD19+CD21loCD23hi) were FACS sorted for qPCR. Dot plots show the expression of PP2AA, and elevated expression was observed in GC and PC compared with MZ and FO. (C) Flow cytometry analysis of the expression of PP2Ac (indicated by mean florescence intensity, MFI) in total B cells from patients with SLE and matched healthy controls. (D) Dot plots show the increased MFI of PP2Ac in DN B cells (CD19+IgD–CD27–), memory B cells (CD19+IgD–CD27+), and plasma B cells (CD19+IgG+CD138+) compared with naive B cells (CD19+IgD+CD27–). (E–H) CD19+ human B cells were enriched by magnetic beads and cultured with the indicated stimuli for the indicated time. (E) Dot plots show the expression of PP2Aa in B cells stimulated with either CpG or anti-CD40 compared with unstimulated B cells 3 hours after stimulation. (F) Dot plots show the expression of PP2Aa in B cells stimulated with either CpG or anti-CD40 compared with unstimulated B cells 3 hours after stimulation. (G) Western blot analysis of the expression of PP2Aa and PP2Ac in human B cells stimulated with either CpG or anti-CD40 for 48 hours. (H) Dot plots show the quantification of PP2Aa and expression PP2Ac in human B cells stimulated with either CpG or anti-CD40 compared with control unstimulated B cells 3 hours after stimulation. (I and J) PP2A phosphatase activity was quantified using a kit from R&D. The activity of PP2A is presented as the rate of phosphate release (pmol × 102). (I) Bar graph shows the PP2A phosphatase activity in ex vivo splenic B cells from lupus-prone Mrl.lpr mice compared with matching control Mrl.mpj mice (data pooled from 3 independent experiments, paired t test, mean ± SEM). (J) Splenic B cells were enriched from C57BL/6J WT mice by MACS and stimulated with the indicated reagents for several time periods; kinetic curves show the PP2A phosphatase activity (n = 3 for 3 independent experiments, 2-way ANOVA analysis, mean ± SEM).

