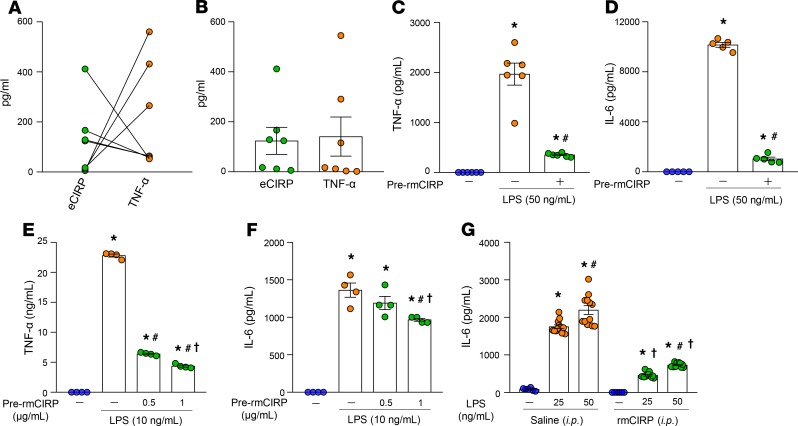
Figure 1. eCIRP induces macrophage tolerance.
(A) Sepsis was induced in mice by CLP. Blood and spleen were collected 72 hours after CLP. eCIRP levels in the serum were assessed. Splenocytes were isolated from the septic mouse and stimulated with LPS (100 ng/mL) for 5 hours ex vivo and assessed for TNF-α in the culture supernatants. Data show the correlation between serum level of eCIRP and culture supernatant level of TNF-α from splenocytes treated with ex vivo LPS for each mouse. Green circle, eCIRP; orange circle, TNF-α. n = 7 mice/group. (B) TNF-α levels in the serum were assessed and presented with serum levels of eCIRP. Data are expressed as mean ± SEM (n = 7 mice/group). (C and D) A total of 7 × 10⁵/mL peritoneal macrophages isolated from healthy mice were prestimulated with PBS or rmCIRP (1 μg/mL) for 24 hours, and the cells were washed with medium. Macrophages were restimulated with LPS (50 ng/mL) for 5 hours and assessed for (C) TNF-α and (D) IL-6 in the culture supernatants. Data are expressed as mean ± SEM (n = 5–6 wells/group). Experiments were repeated, and the repeated experimental data are shown in Supplemental Figure 7. *P < 0.05 vs. PBS control; #P < 0.05 vs. pre-rmCIRP (–), LPS (+). (E and F) RAW264.7 macrophages (3 × 10⁵/mL) were pretreated with PBS or rmCIRP at 0.5 and 1.0 μg/mL for 24 hours. Cells were washed with medium, restimulated with LPS (10 ng/mL) for 5 hours and assessed for (E) TNF-α and (F) IL-6 in the culture supernatants. Data are expressed as mean ± SEM (n = 4 wells/group). Experiments were repeated, and the repeated experimental data are shown in Supplemental Figure 7. *P < 0.05 vs. PBS control; #P < 0.05 vs. pre-rmCIRP (–), LPS (+); †P < 0.05 vs. rmCIRP (0.5 μg/mL). (G) Mice were injected with normal saline or rmCIRP (5 mg/kg BW) intraperitoneally (i.p.); 24 hours after injection, peritoneal macrophages were isolated. A total of 2 × 10⁵ peritoneal macrophages were stimulated with 25 and 50 ng/mL LPS for 5 hours ex vivo and assessed for IL-6 in the culture supernatants. Data are expressed as mean ± SEM (n = 6–12 samples/group). Experiments were performed 2 times, and all data were used for analysis. The groups were compared by 1-way ANOVA and Student-Newman-Keuls (SNK) method. *P < 0.05 vs. PBS in respective injection group, #P < 0.05 vs. LPS (25 ng/mL) in respective injection group, and †P < 0.05 vs. saline injection in respective LPS dose. CLP, cecal ligation and puncture.

