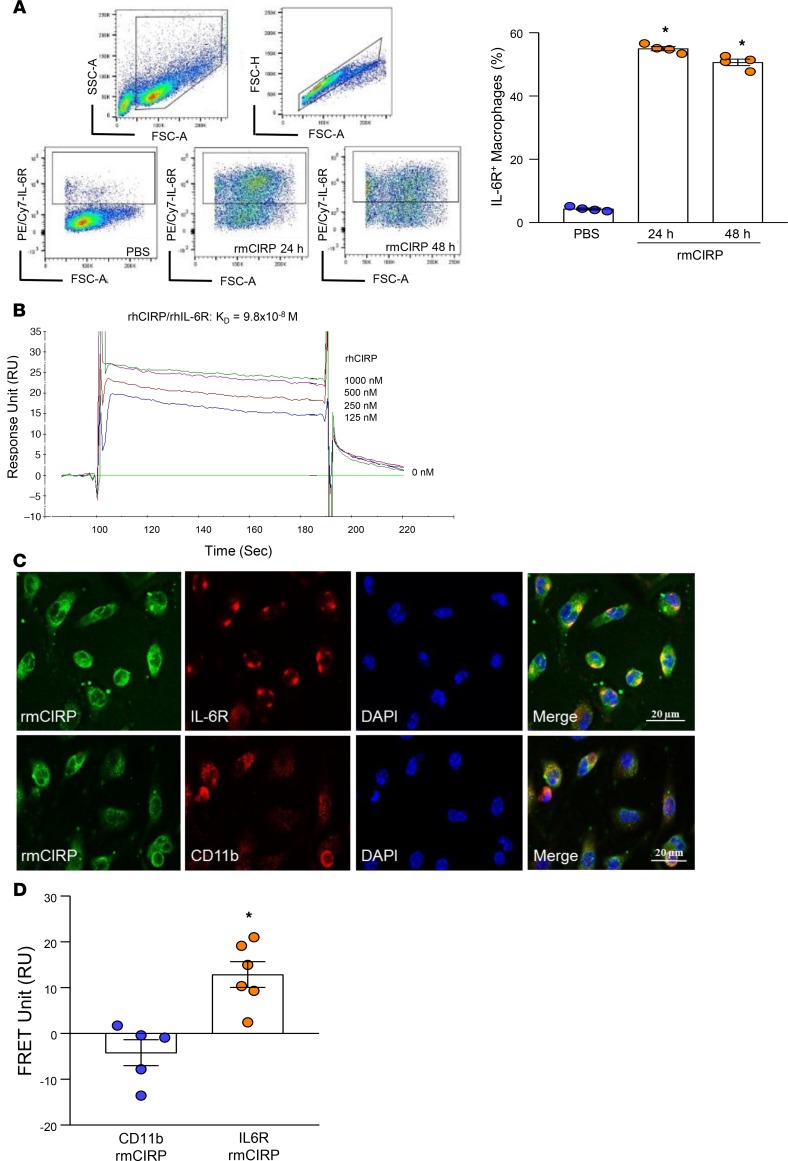
Figure 4. Identification of IL-6R as a potentially novel receptor of eCIRP in macrophages.
(A) RAW264.7 cells (1 × 10⁶/mL) were stimulated with rmCIRP (1 μg/mL), and surface expression of IL-6R was assessed at 24 and 48 hours following rmCIRP treatment by flow cytometry. Data are expressed as mean ± SEM (n = 4 samples/group). Experiments were repeated, and the repeated experimental data are shown in Supplemental Figure 9. The groups were compared by 1-way ANOVA and SNK method (*P < 0.05 vs. PBS). (B) SPR (Biacore assay) was performed between rhCIRP and rhIL-6R. rhIL-6R as a ligand was immobilized on the chip. rhCIRP was injected as an analyte in concentrations of 0–1000 nM. The association and dissociation of analyte with ligand at the indicated concentration were recorded, and binding kinetics of rhCIRP and rhIL-6R was calculated. (C) Peritoneal macrophages (4 × 10⁵/mL) were treated with rmCIPR (5 μg/mL) at 4°C for 10 minutes, immediately fixed with paraformaldehyde, and stained with rabbit anti-mouse CIRP Ab, goat anti–mouse IL-6R Ab, and goat anti–mouse CD11b Ab followed by Cy3-conjugated donkey anti–rabbit IgG and Cy5-conjugated donkey anti–goat IgG. The images were obtained by using a Zeiss confocal microscope under 63× objective. The colocalization of rmCIRP and IL-6R is indicated by the merged images (shown in yellow color). Scale bar: 20 μm. (D) After the staining protocol described in (C), cell-associated fluorescence was measured on a Biotek Synergy Neo2 at 579 nm upon excitation at 540 nm (E1), at 681 nm after excitation at 640 nm (E2), and at 681 nm after excitation at 540 nm (E3) for FRET unit calculation. The transfer of fluorescence was calculated as FRET units. FRET unit = (E3both − E3none) − ([E3Cy5 − E3none] × [E2both/E2Cy5]) − ([E3Cy3 − E3none] × [E1both/E1Cy3]). Data are expressed as mean ± SEM (n = 5–6 wells/group). Experiments were repeated 3 times. Groups compared by 2-tailed Student’s t test (*P < 0.01 vs. CD11b).

