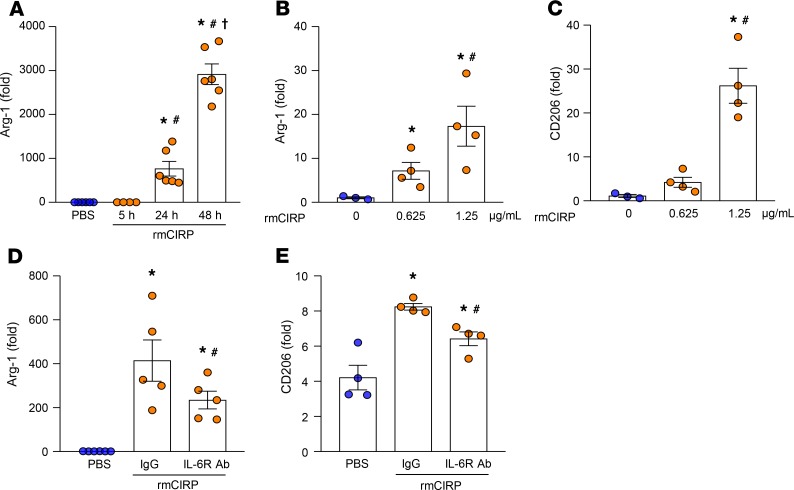
Figure 6. eCIRP induces M2 polarization through IL-6R.
(A) RAW264.7 cells (1 × 10⁶/mL) were treated with rmCIRP (1 μg/mL) for 5, 24, or 48 hours. Arg-1 expression at the mRNA level was assessed by quantitative (qPCR). Expression of Arg-1 was normalized to β-actin expression and represented as fold induction compared with the normalized values of PBS control–treated cells. Data are expressed as mean ± SEM (n = 4–6 samples/group). Experiments were repeated, and the repeated experimental data are shown in Supplemental Figure 11. The groups were compared by 1-way ANOVA and SNK method. *P < 0.05 vs. PBS (control); #P < 0.05 vs. rmCIRP (5 hours); †P < 0.05 vs. rmCIRP (24 hours). (B and C) RAW264.7 cells (1 × 10⁶/mL) were treated with rmCIRP at doses of 0.625 and 1.25 μg/mL for 48 hours; the expression of Arg-1 and CD206 mRNAs was assessed by qPCR and normalized to β-actin expression. Results are represented as fold induction compared with the normalized values of PBS control–treated cells. Data are expressed as mean ± SEM (n = 4 samples/group). Experiments were repeated, and the repeated experimental data are shown in Supplemental Figure 11. The groups were compared by 1-way ANOVA and SNK method. *P < 0.05 vs. rmCIRP (0 μg/mL or PBS); #P < 0.05 vs. rmCIRP (0.625 μg/mL). (D and E) RAW264.7 cells (1 × 10⁶/mL) were pretreated with IgG (3 μg/mL) or anti–IL-6R Ab (3 μg/mL) for 30 minutes. These cells were then stimulated with PBS or rmCIRP (1 μg/mL) for 24 hours, and then Arg-1 and CD206 were assessed by qPCR and flow cytometry, respectively. Arg-1 mRNA was normalized to β–actin, and data expressed in fold induction were compared with the PBS-treated condition. Data are expressed as mean ± SEM (n = 4–6 samples/group). Experiments were repeated 2 times, and all data were used for analysis. The groups were compared by 1-way ANOVA and SNK method (*P < 0.05 vs. PBS; #P < 0.05 vs. IgG + rmCIRP).

