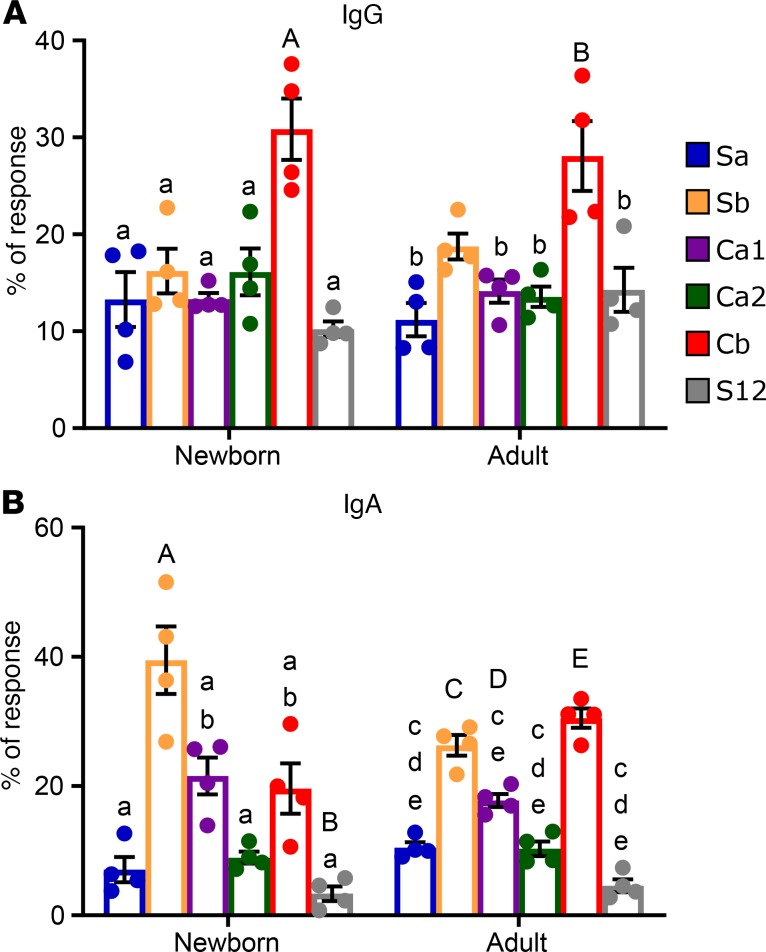
Figure 3. ID hierarchy of HA-specific IgG and IgA Ab in newborn and adult AGMs.
The proportion of IgG (A) and IgA (B) that binds each of the Δ4 HA molecules relative to WT HA-specific Ab in newborn and adult AGM at day 14 p.i. was determined (n = 4/group). Ab binding to each site was calculated as in Figure 2. The initial plasma dilution was 1:160 for IgG and 1:20 for IgA. Significance was determined by 1-way ANOVA with a Holm-Šídák test for multiple comparisons and is denoted as described in Figure 2. The threshold for significance was P < 0.05.

