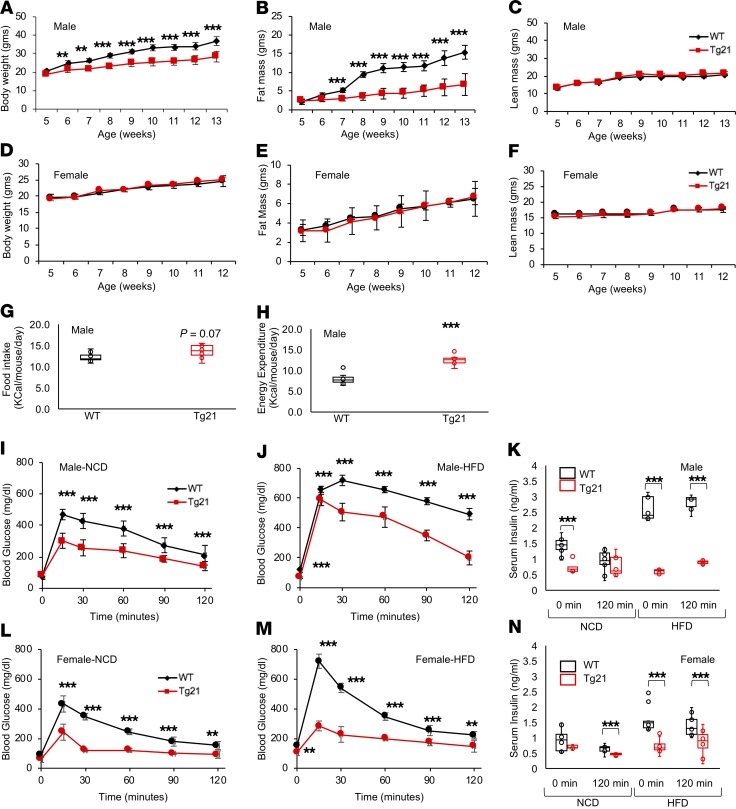
Figure 1. During DIO, Tg21 mice show reduced weight gain/fat mass accumulation and increased energy expenditure in male mice and improved glucose utilization in male and female mice.
(A–F) Body weight (A and D), fat mass (B and E), and lean mass (C and F) in HFD-fed Tg21 and WT mice beginning at 5 weeks of age in male mice (A–C) and female mice (D–F). (G and H) Daily average food intake (G) and daily energy expenditure (H) at 5–8 weeks of age on HFD feeding in male Tg21 and WT mice. (I–N) Glucose tolerance test (GTT) and serum insulin in males (I–K) and females (L–N) in Tg21 (red line) and WT (black line) mice during NCD (age, 5 weeks, I and L) and after 3 weeks of HFD (age, 8 weeks, J and M). Serum insulin measurements at the beginning (0 minutes) and end (120 minutes) of GTT during NCD and HFD in male (K) and female (N) mice. Each graph is representative of at least 3 independent experiments; n = 8–10 for each data point. For line graph, each data point represents mean ± SD. In box-and-whisker plots, bounds denote the 25th to 75th percentile, the lines represent the medians, and whiskers indicate the range from minimum to maximum values and includes outliers. **P < 0.01, ***P < 0.001 (2-way ANOVA).

