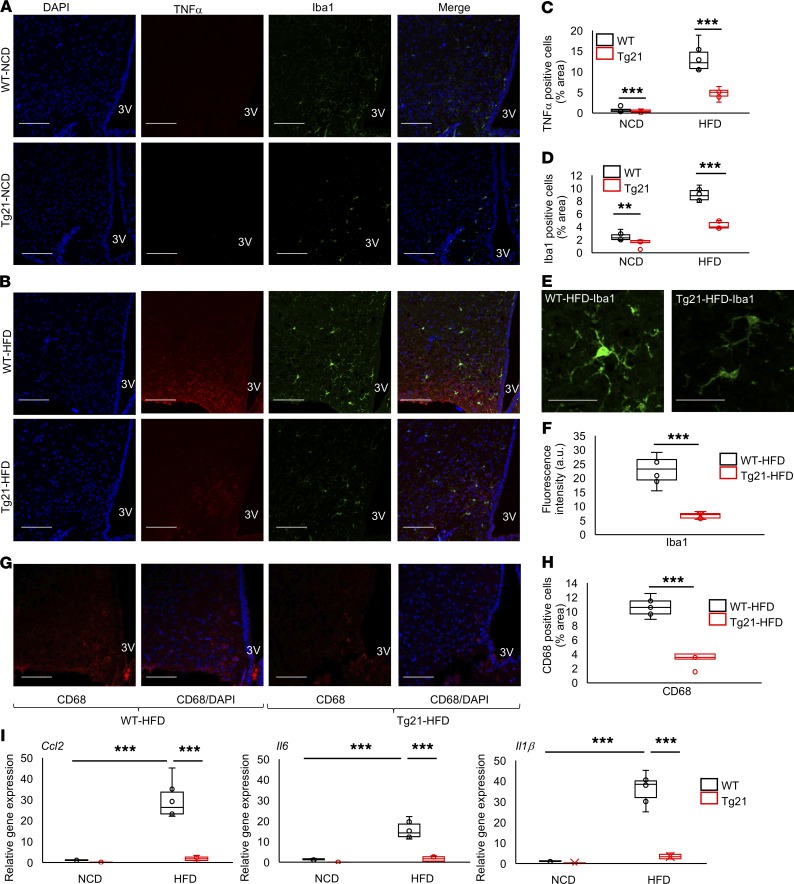
Figure 2. Reduced hypothalamus inflammatory response and microglial cell activation in Tg21 male mice compared with WT male mice.
(A and B) Representative hypothalamic sections of age-matched (8 weeks) male WT and Tg21 mice during NCD (A) or after 3 weeks of HFD feeding (B) stained for the nuclear marker, DAPI; inflammatory marker, TNF-α; and microglial cell marker, Iba1. 3V, third ventricle. Scale bar: 100 μm. Original magnification, ×40. (C and D) Quantification of A and B to denote TNF-α+ and Iba1+ cells. (E and F) Representative fields of view in HFD-fed WT and Tg21 mice (scale bar: 20 μm) (E), analyzed for quantification of fluorescence intensity of Iba1 (F). (G and H) Representative hypothalamic sections of age-matched (8 weeks) male WT and Tg21 mice after 3 weeks of HFD feeding stained for activated microglial cell markers, CD68 and DAPI (scale bar: 100 μm; original magnification, ×40) (G), and quantification of CD68+ cells (H). Each image is representative of n = 8–10/group. (I) Gene expression of markers Ccl2, Il6, and Il1β in the hypothalamus of age-matched (8 weeks) male Tg21 and WT mice on NCD or after 3 weeks of HFD, as determined by quantitative RT-PCR, normalized to WT control on NCD and adjusted to Gapdh gene expression (n = 8–10/group). In box-and-whisker plots, bounds denote the 25th to 75th percentile, the lines represent the medians, and whiskers indicate the range from minimum to maximum values and includes outliers. **P < 0.01, ***P < 0.001 (2-way ANOVA).

