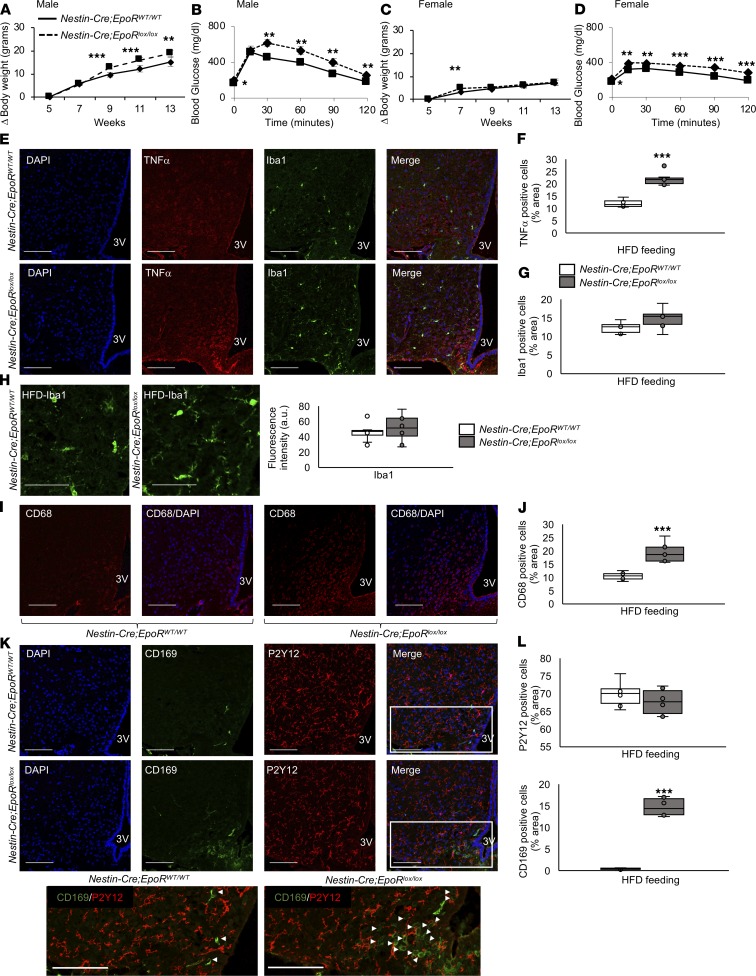
Figure 4. Knockout of the EpoR gene in neuronal cells in mice increased weight gain, glucose intolerance, hypothalamus inflammation, and myeloid cell recruitment in the MBH.
(A and C) Weight gain during HFD feeding from 5 to 13 weeks of age. (B and D) Glucose tolerance test was carried out after 4 weeks of HFD feeding at age 9 weeks. (E–H) Representative hypothalamic sections of age-matched (8 weeks) male nestin-Cre;EpoRWT/WT and nestin-Cre;EpoRloxP/loxP mice after 3 weeks of HFD feeding stained for the nuclear marker, DAPI; inflammatory marker, TNF-α; microglial cell marker, Iba1 (E). (F and G) Quantification was done for TNF-α+ and Ibal1+ cells. (H) Representative fields of view in HFD-fed male nestin-Cre;EpoRWT/WT and nestin-Cre;EpoRloxP/loxP mice, analyzed for quantification of fluorescence intensity of Iba1. (I–J) Male nestin-Cre;EpoRWT/WT and nestin-Cre;EpoRloxP/loxP mice after 3 weeks of HFD feeding were also stained for activated microglial cell markers, CD68 and DAPI, in the MBH, and (I) representative images are shown. (J) Quantification was done for CD68+ cells. (K and L) Representative images from CD169 and P2Y12 staining of hypothalamic sections from male nestin-Cre;EpoRWT/WT and nestin-Cre;EpoRloxP/loxP mice after 3 weeks of HFD feeding, and visualization of boxed areas without DAPI staining and arrowheads pointing to CD169+ cells (K). Quantitative analysis results of P2Y12+ and CD169+ cells (L). Scale bar: 20 μm (H); 100 μm (E, I, and K). Original magnification, ×40 (except in H, ×80). 3V, third ventricle. Each image is representative of n = 8–10/group. For line graph, each data point represents mean ± SD. In box-and-whisker plots, bounds denote the 25th to 75th percentile, the lines represent the medians, and whiskers indicate the range from minimum to maximum values and includes outliers. *P < 0.05, **P < 0.01, ***P < 0.001 (2-way ANOVA).

