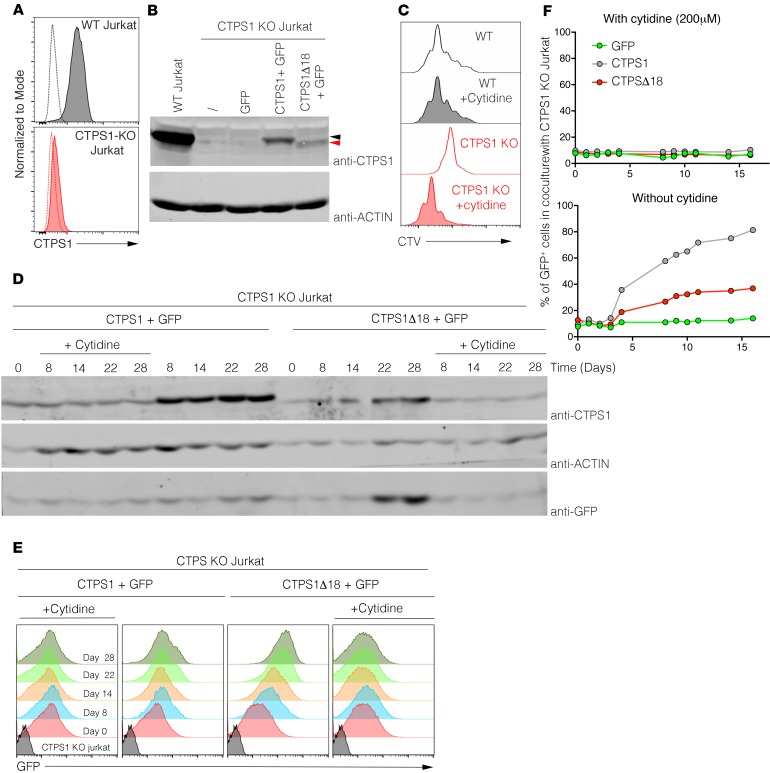
Figure 6. Expression of CTPS1D18 mutant partially restores the proliferation of CTPS1-deficient Jurkat cells.
(A) Histograms representing flow cytometry analysis of CTPS1 expression in WT (gray) or CTPS1-KO (red) Jurkat cells. Isotype staining is represented by dotted lines. (B) Immunoblots for CTPS1 and actin protein expression in lysates of WT, CTPS1-KO, or complemented CTPS1-KO Jurkat cell lines. CTPS1-KO Jurkat cells were complemented with lentivirus expressing GFP, CTPS1 plus GFP, CTPS1Δ18 plus GFP, or the empty lentivirus (shown with a slash). Black and red arrows indicate CTPS1 and CTPS1Δ18 proteins, respectively. (C) Analysis of WT (gray histogram) and CTPS1-KO (red histogram) Jurkat cell proliferation using cell trace violet staining. Cells were treated or not with 200 μM of cytidine for 4 days. Data shown are representative of 2 independent experiments. (D) Immunoblots for CTPS1, actin, and GFP protein expressions in lysates of CTPS1 and CTPS1Δ18 complemented CTPS1-KO Jurkat cell lines at different times of culture in the presence or not of cytidine. (E) Same as D except that GFP protein expression was quantified by flow cytometry and represented in histograms. (F) Percentage of GFP+ cells in cocultures of CTPS1-KO Jurkat cells complemented with GFP alone (green symbols), CTPS1Δ18 plus GFP (red symbols), or WT CTPS1 plus GFP (gray symbols) with noncomplemented CTPS1-KO Jurkat cells at a 1:10 ratio for 16 days. Cells were cultured with cytidine (left) or not (right). Percentage values were obtained from FACS analysis. Data shown are representative of 2 independent experiments.

