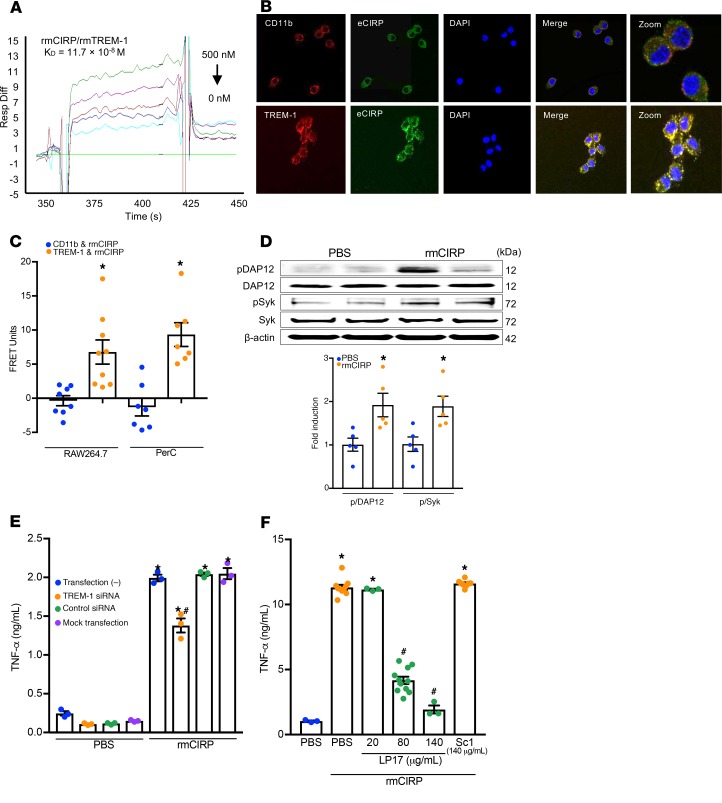
Figure 1. eCIRP binds TREM-1 to promote inflammation.
(A) SPR between rmCIRP and rmTREM-1. Anti-his antibody was used to capture rmCIRP-his. rmTREM-1 was injected as an analyte in concentrations of 0 to 500 nM. (B) RAW264.7 cells were treated with rmCIRP (5 μg/mL) at 4°C for 10 minutes, fixed in a nonpermeabilized fashion, and stained with primary antibodies against CIRP, TREM-1, and CD-11b as well as fluorescently labeled secondary antibodies. Confocal microscopy images were obtained with a 63× objective. Colocalization is indicated by the yellow color. (C) After the staining protocol described in B, cell-associated fluorescence was measured. The transfer of fluorescence was calculated as FRET units. Data are expressed as mean ± SEM obtained from 3 independent experiments; n = 8–9/group. Groups compared by unpaired t test (*P < 0.01 vs. CD11b). (D) RAW264.7 cells were stimulated with rmCIRP (1 μg/mL) for 10 minutes. Extracted proteins were immunoprecipitated by using anti-DAP12 antibody, followed by Western blotting using phospho-Tyr (p-Tyr; 4G10) and DAP12 antibody. Extracted total proteins obtained from RAW264.7 cells stimulated with rmCIRP (1 μg/mL) for 10 minutes were subjected to Western blotting using p-Syk, Syk, and β-actin antibodies. Representative Western blots for phosphotyrosine (4G10), DAP12, p-Syk, Syk, and β-actin are shown. Phosphotyrosine (p-DAP12) and p-Syk expression in each sample was normalized to DAP12 or Syk or β-actin expression and the mean values of 0 minutes of rmCIRP-treated groups were standardized as one for comparison. Data are expressed as mean ± SEM (n = 5 samples/group). The groups were compared by 1-way ANOVA and Tukey’s method (*P < 0.05 vs. PBS). (E) RAW264.7 cells were transfected as shown. Cells were stimulated with PBS control or 1 μg/mL rmCIRP. After 6 hours, TNF-α in the supernatant was analyzed by ELISA. Data are expressed as mean ± SEM (n = 3 samples/group). Multiple groups were compared by 1-way ANOVA and Tukey’s method (*P < 0.05 vs. respective PBS group; #P < 0.01 vs. rmCIRP-treated nontransfected cells). (F) RAW264.7 cells were stimulated with PBS or rmCIRP (1 μg/mL). Simultaneously cells were treated with various doses of LP17 or LP17-Sc1. After 24 hours, TNF-α in culture supernatants was measured by ELISA. Data are expressed as mean ± SEM obtained from 5 independent experiments (n = 3–10 wells/group). The groups were compared by Kruskal-Wallis test with Dunn’s method (*P < 0.05 vs. PBS; #P < 0.05 vs. rmCIRP). FRET, fluorescence resonance energy transfer; PerC, peritoneal cavity; ELISA, enzyme-linked immunosorbent assay; PBS, phosphate-buffered saline.

