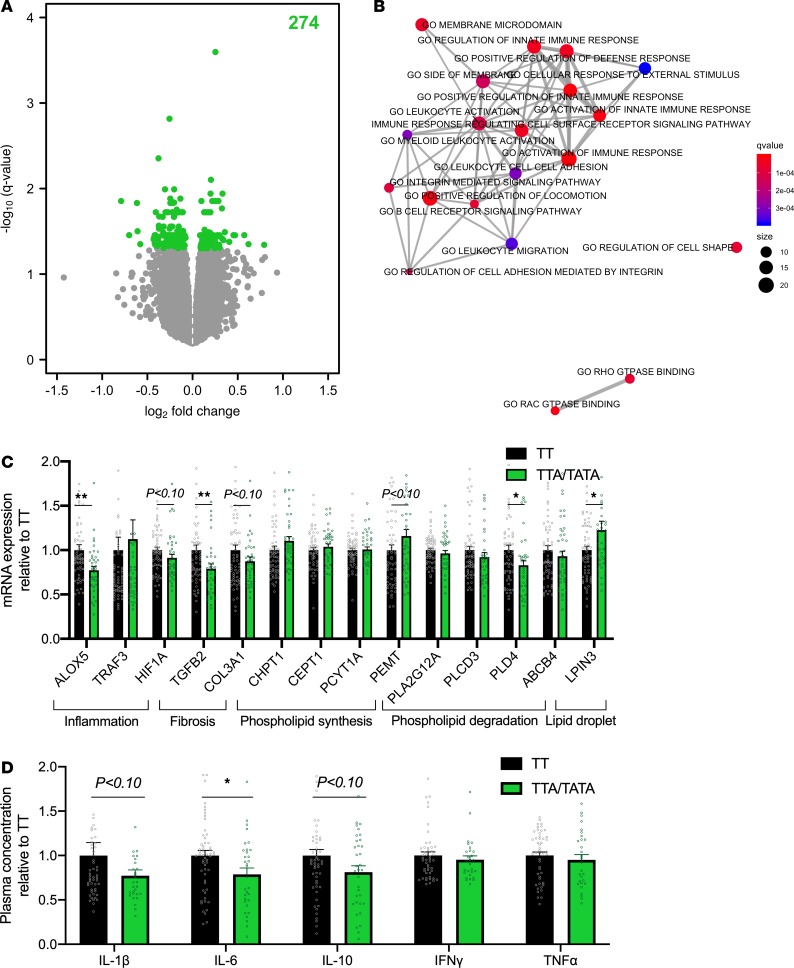
Figure 3. Decreased hepatic inflammation in carriers of the HSD17B13 rs72613567 variant.
(A) Volcano plot of differentially expressed genes in the livers of carriers (TTA/TATA, n = 36) as compared with noncarriers (TT, n = 50) of the HSD17B13 rs72613567 variant. The x axes denote log2 fold change and y axes denote the –log10 of the q value of expression of genes in the livers of carriers as compared with noncarriers. The number in green denotes the amount of significantly differentially expressed genes. The analysis was performed by limma. (B) Enrichment map of gene ontology (GO) pathways of differentially expressed genes in the livers of carriers as compared with noncarriers of the HSD17B13 variant. Data were analyzed using the enricher function in the clusterProfiler R package. The color of the bubbles denotes q values and size denotes the number of genes in the pathway. (C) Quantitative PCR analysis of hepatic gene expression in the TTA/TATA (green bars and circles, n = 42) groups as compared with the TT group (black bars and circles, n = 60). The data were tested using independent 2-sample Student’s t test and are expressed relative to the TT group as mean ± SEM. *P < 0.05. ALOX5, arachidonate 5-lipoxygenase; TRAF3, TNF receptor–associated factor 3; HIF1A, hypoxia-inducible factor 1 subunit α; TGFB2, TGF-β2; COL3A1, collagen type III α 1 chain; CHPT1, choline phosphotransferase 1; CEPT1, choline/ethanolamine phosphotransferase 1; PCYT1A, phosphate cytidylyltransferase 1; PEMT, phosphatidylethanolamine N-methyltransferase; PLA2G12A, phospholipase A2, group XIIA; PLCD3, phospholipase C δ 3; PLD4, phospholipase D family member 4; ABCB4, ATP binding cassette subfamily B member 4; LPIN3, lipin 3. (D) Plasma concentrations of IL-1β, IL-6, IL-10, IFN-γ, and TNF-α in the TTA/TATA (green bars and circles, n = 45) groups as compared with the TT group (black bars and circles, n = 70). The data were analyzed using independent 2-sample Student’s t test and are expressed relative to the TT group as mean ± SEM. *P < 0.05.

