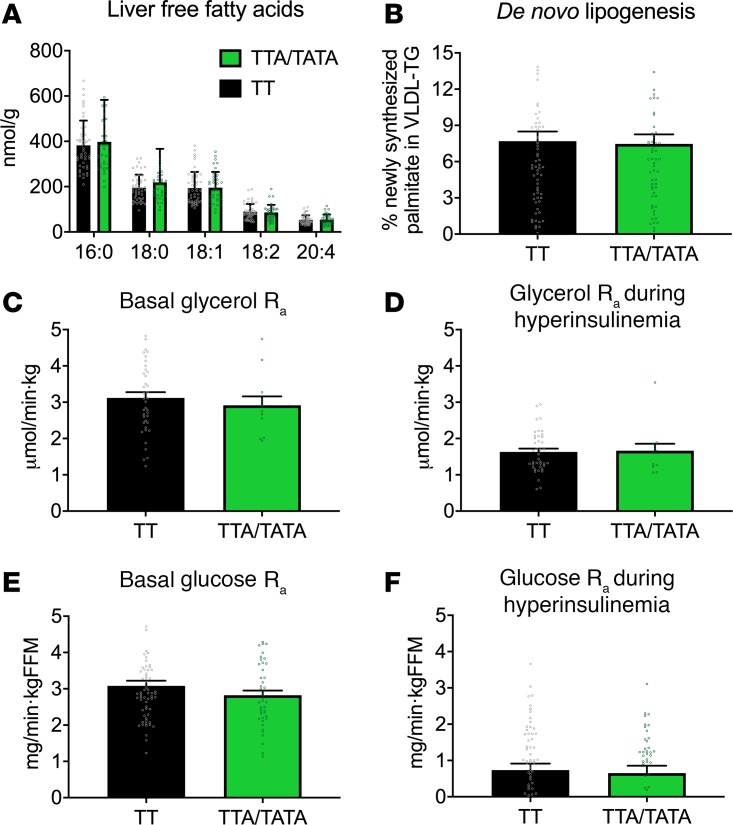
Figure 4. Hepatic free fatty acids, de novo lipogenesis, adipose tissue lipolysis, and hepatic insulin sensitivity are similar in carriers and noncarriers of the HSD17B13 rs72613567 variant.
(A) The concentrations of individual hepatic free fatty acids (TT, n = 48; TTA/TATA, n = 38) and (B) the rate of hepatic de novo lipogenesis (TT, n = 67; TTA/TATA, n = 59) in the HSD17B13 groups. (C) The rate of appearances of glycerol in the basal state and (D) during euglycemic hyperinsulinemia in the TT (n = 40) and TTA/TATA (n = 12) groups. (E) The rate of appearances of glucose in the basal state and (F) during euglycemic hyperinsulinemia in the TT (n = 62) and TTA/TATA (n = 43) groups. The data were analyzed using independent 2-sample Student’s t test and are shown as mean ± SEM. Black bars = TT; green bars = TTA/TATA. FFM, fat free mass.

