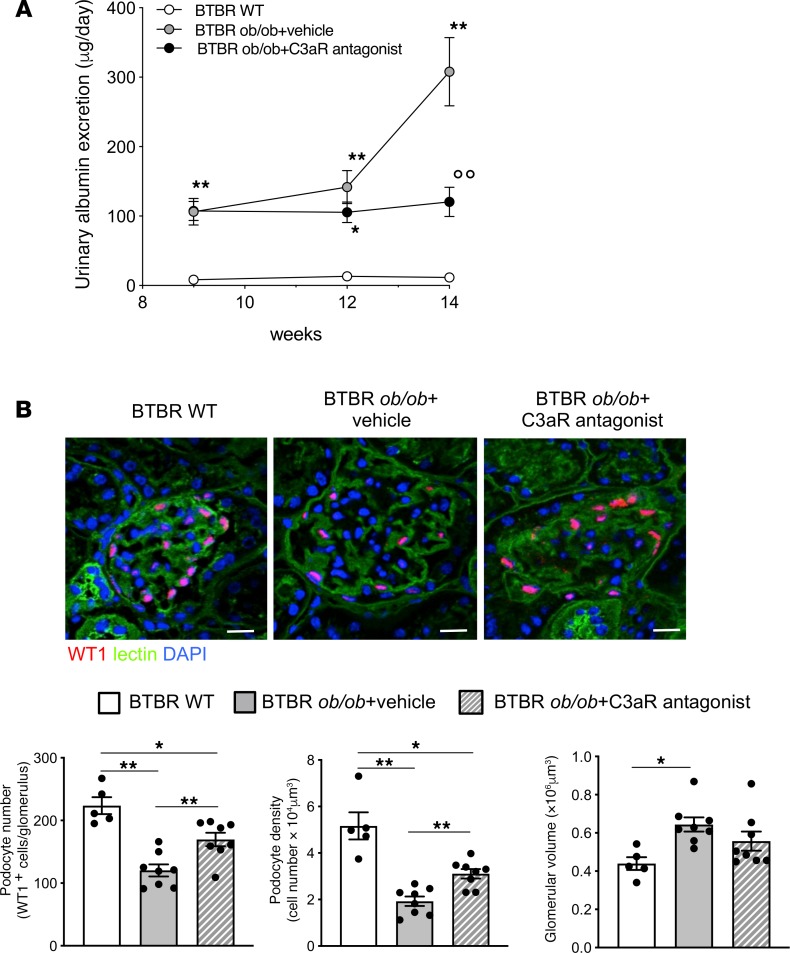
Figure 2. C3aR antagonist reduces albuminuria and limits podocyte loss in BTBR ob/ob mice.
(A) Time course of urinary albumin excretion in BTBR WT and BTBR ob/ob mice treated with vehicle or C3aR antagonist (5 mg/kg/d). Results are presented as mean ± SEM (WT mice, n = 5; BTBR ob/ob+vehicle, n = 8; BTBR ob/ob+C3aR antagonist, n = 8), and ANOVA with Tukey multiple-comparisons test was used. *P < 0.05, **P < 0.01 vs. WT, °°P < 0.01 vs. vehicle. (B, top) Representative images of WT1 (red) and FITC-WGA-lectin (green) in BTBR WT and BTBR ob/ob mice injected with vehicle or C3aR antagonist. Nuclei were counterstained with DAPI (blue). Scale bars: 20 μm. (B, bottom) Morphometrical estimations of podocyte number (left), podocyte density (middle), and glomerular volume (right). Results are expressed as mean ± SEM (WT, n = 5; BTBR ob/ob+vehicle, n = 8; BTBR ob/ob+C3aR antagonist, n = 8), and ANOVA with Tukey multiple-comparisons test was used. *P < 0.05, **P < 0.01.

