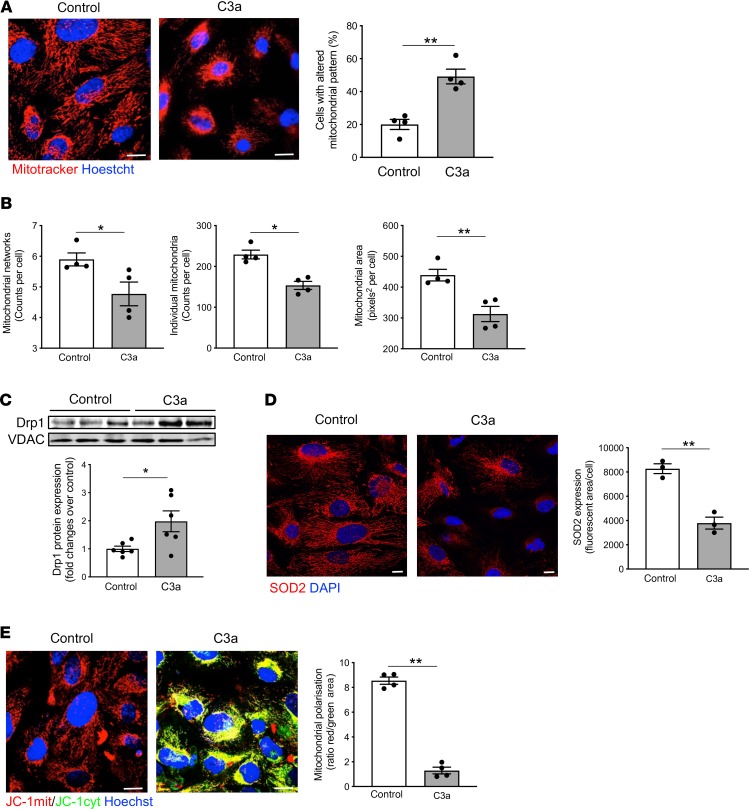
Figure 5. C3a affects mitochondrial functional integrity in cultured podocytes.
(A) Representative images of mitochondria labeled with MitoTracker in human podocytes exposed to control medium or C3a (1 μM) for 6 hours. Nuclei were counterstained with Hoechst (blue). Scale bars: 20 μm. The percentage of podocytes with an altered mitochondrial pattern, in terms of fragmentation and perinuclear redistribution, on total cells per field was quantified. Results are expressed as mean ± SEM (n = 4), and unpaired Student’s t test was used. **P < 0.01. (B) Quantification of mitochondrial networks, individual mitochondria, and mitochondrial area by Mitochondrial Network Analysis (MiNA) tool set in control or C3a-treated podocytes labeled with MitoTracker. Results are expressed as mean ± SEM (n = 4), and unpaired Student’s t test was used. *P < 0.05, **P < 0.01. (C) Western blot and densitometric analysis of Drp1 protein expression in purified mitochondrial fraction isolated from podocytes after incubation with control medium or C3a for 6 hours. VDAC protein expression was used as a sample loading control. Results are expressed as mean ± SEM (n = 6), and unpaired Student’s t test was used. *P < 0.05. (D) Representative images and quantification of SOD2 expression (red) in control or C3a-treated podocytes for 6 hours. Nuclei were stained with DAPI (blue) Scale bars: 20 μm. Results are expressed as mean ± SEM (n = 3), and unpaired Student’s t test was used. **P < 0.01. (E) Representative images and quantification of mitochondrial membrane potential in podocytes exposed for 6 hours to control medium or C3a. Mitochondrial potential was evaluated by staining with JC-1, a dye sensitive to mitochondrial membrane potential changes that shifts the emission spectrum from red (mitochondrial distribution, JC-1mit) to green (cytoplasmic distribution, JC-1 cyt). Nuclei were counterstained with Hoechst (blue). Mitochondrial membrane potential was evaluated as the ratio between red and green fluorescent areas and normalized for total cells/field. Scale bars: 20 μm. Results are expressed as mean ± SEM (n = 4), and unpaired Student’s t test was used. **P < 0.01.

