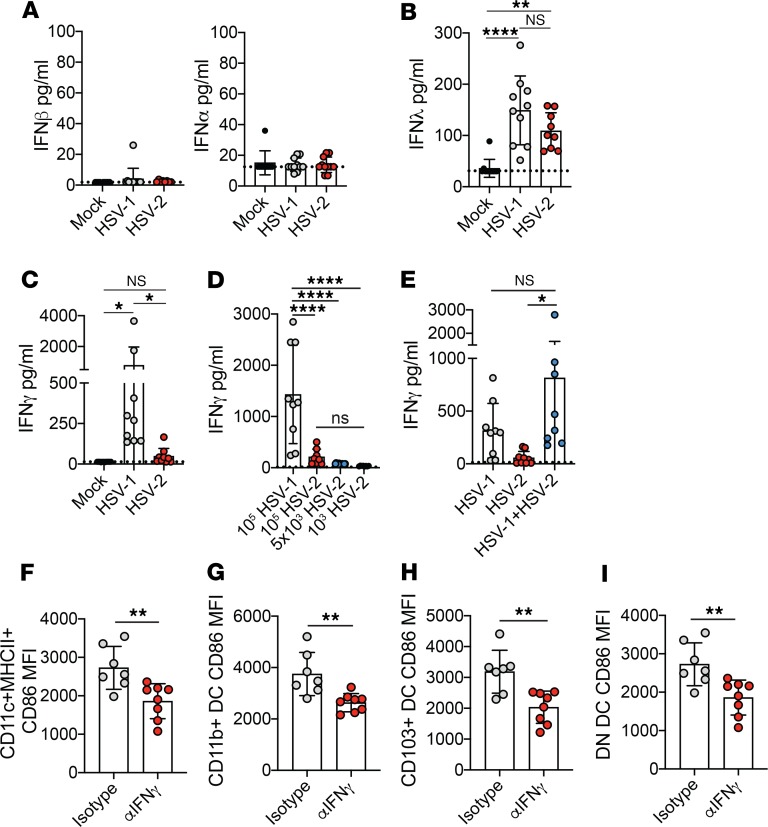
Figure 3. IFN-γ production occurs early after HSV-1 but not HSV-2 infection.
Infections were performed as described in Figure 2. IFN-β (mock, n = 10; HSV-1, n = 12; HSV-2, n = 8) and IFN-α (mock, n = 9; HSV-1, n = 11; HSV-2, n = 11) (A), IFN-λ (mock, n = 11; HSV-1, n = 10; HSV-2, n = 10) (B), and IFN-γ (mock, n = 15; HSV-1, n = 9; HSV-2, n = 9) (C) were measured at 1 d.p.i. from vaginal washes. Dashed lines indicate limit of detection. (D) Mice were inoculated with 1 × 10⁵ PFU HSV-1 (n = 9), 1 × 10⁵ HSV-2 (n = 8), 5 × 10³ PFU HSV-2 (n = 8), or 1 × 10³ PFU HSV-2 (n = 8), and IFN-γ was measured at 1 d.p.i. from vaginal washes. (E) Mice were inoculated with 1 × 10⁴ PFU HSV-1 alone or 1 × 10⁴ PFU HSV-2 alone, or coinoculated with 1 × 10⁴ PFU HSV-1 and HSV-2 (n = 9 for all groups). IFN-γ production was measured at 1 d.p.i from vaginal washes. In F–I, HSV-1–infected mice were treated intravaginally with 100 μg αIFN-γ neutralizing antibody (n = 8) or isotype control (n = 7) 1 d.p.i. CD86 expression on total DC (CD11c+MHCII+) (F), CD11b+ DC (G), CD103+ DC (H), and DN DC (I) was measured 2 d.p.i. All data are pooled from 2 independent experiments. Error bars show ± SD. Dashed lines in graphs show limit of sensitivity for ELISA assay. Statistical significance was measured by 1-way ANOVA with Tukey’s multiple comparisons test (A–E) or 2-tailed Student’s t test (F–I). *P < 0.05, **P < 0.01, ****P < 0.001.

