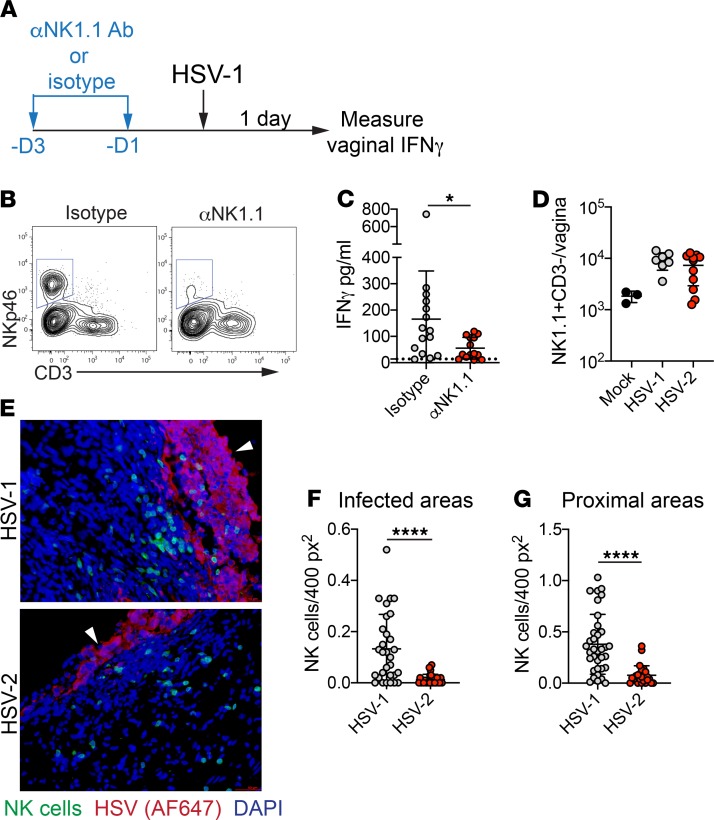
Figure 4. NK cells mediate IFN-γ production early after HSV-1 infection.
(A) Experimental schematic for NK cell depletion. At 3 and 1 days prior to infection with HSV-1 (performed as describe in Figure 1), mice were injected i.p. with 200 μg αNK1.1 antibody or an isotype control. (B) Flow plots show NK cell depletion in the vagina 1 day after HSV-1 infection. Flow plots are gated on Ly6G- live cells. (C) IFN-γ was measured by ELISA from vaginal washes taken 1 d.p.i. (isotype, n = 15; αNK1.1, n = 15). (D) NK cell numbers in the vagina 1 d.p.i. (mock, n = 3; HSV-1, n = 7; HSV-2, n = 11). (E) Immunofluorescent analysis of vaginal tissue sections from Ncr1mT/mG reporter mice at 1 day after HSV-1 or HSV-2 infection. NK cells are shown in green, HSV proteins (detected with Alexa Fluor 647) are shown in red, and nuclei are shown in blue. White arrowheads indicate luminal border of the epithelium. NK cell numbers were counted in infected areas (HSV-1, n = 30; HSV-2, n = 25) (F) and in areas proximal to infected areas (within 12 × 104 pixels, approximately 75 μm) (HSV-1, n = 35; HSV-2, n = 25). (G). At least 2 infected areas were counted from 4 independent sections with 3 mice per group. Data are pooled from 2 (D–G) or 3 (B) independent experiments. Horizontal bars show mean (C, F, G) or geometric mean (D); error bars show ± SD. Statistical significant was measured by 2-tailed Student’s t test (C), 1-way ANOVA with Tukey’s multiple comparisons test (D), or Mann-Whitney U test (F and G). *P < 0.05, ****P < 0.001.

