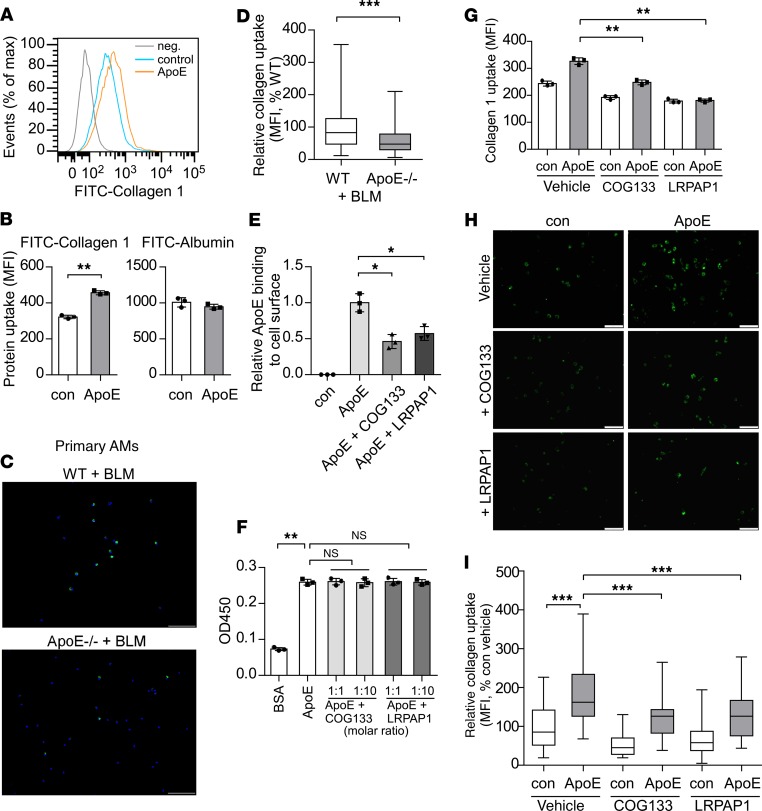
Figure 6. ApoE promotes type I Collagen phagocytosis by macrophages, which is dependent on LRP1.
(A and B) FITC-conjugated type I Collagen or albumin (50 μg/mL) was preincubated with conditioned media with or without mouse ApoE. The mixtures were then incubated with mouse alveolar macrophages for 4 hours. After extensive wash, flow cytometry was performed in the presence of 0.02% trypan blue. Cells without incubation with Collagen I were used as a negative control (neg.) (A). Collagen I or albumin uptake was reflected by mean fluorescence index (MFI) (B). n = 3; mean ± SD; **P < 0.01 by 2-tailed Student’s t test. (C) Six-week-old WT and ApoE–/– male mice were i.t. instilled with BLM. Four weeks later, mice were i.t. injected with 50 μg FITC-conjugated type I Collagen. Two hours later, AMs were isolated, and representative images of the AMs demonstrating Collagen I uptake are shown. Original magnification, ×200. Scale bars: 100 μm. (D) Quantitation of single cell fluorescence intensity was performed by ImageJ with a minimum of 200 cells analyzed and average calculated. Relative levels of Collagen I uptake are shown. ***P < 0.001 by 2-tailed Student’s t test. (E) Alveolar macrophages were preincubated with 2 μg/mL BSA, COG133, or LRPAP1 for 30 minutes. The cells were then incubated with conditioned media with or without ApoE for 30 minutes. After extensive wash, cell surface–bound ApoE was determined by flow cytometry. n = 3 for each group; mean ± SD. (F) A 96-well high-binding plate was precoated with 10 μg/mL Collagen I overnight at 4°C. Wells were washed and incubated with 50 ng/mL BSA or 50 ng/mL ApoE together with the indicated amounts of COG133 or LRPAP1, followed by incubation with ApoE antibody and HRP-conjugated secondary antibody and development with TMB substrate. n = 3; mean ± SD. (G) Alveolar macrophages were preincubated with 2 μg/mL BSA, COG133, or LRPAP1 for 30 minutes. The cells were then incubated with mixture of type I Collagen with control or ApoE conditioned media for 4 hours, followed by flow cytometry as in A and B. n = 3; mean ± SD. (H and I) Alveolar macrophages were treated as in G. Original magnification, ×400. Scale bars: 50 μm (H). Quantitation of single cell fluorescence intensity was performed by ImageJ and average calculated. Relative levels of Collagen I uptake are shown (I). *P < 0.05, **P < 0.01, ***P < 0.001 by 1-way ANOVA with Bonferroni’s post hoc test (E–I). The box-and-whisker plots depict the 25th and 75th percentiles and median, minimum, and maximum values (D and I).

