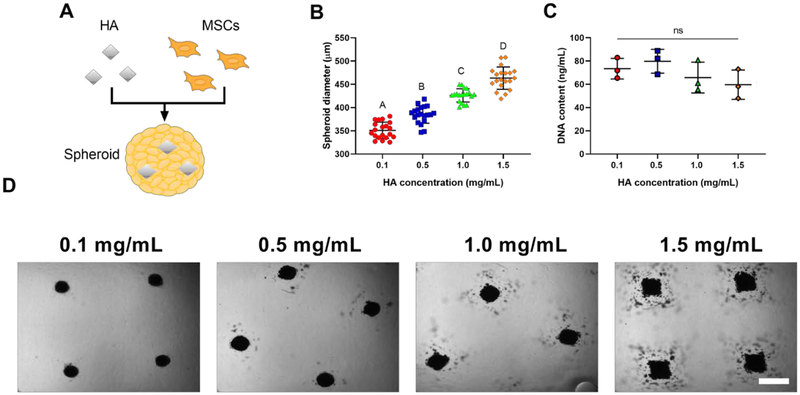
Figure 1.
MSC spheroid morphology and diameter are influenced by HA concentration. (A) Schematic of HA incorporation into spheroids. (B) Spheroid diameter as a function of HA incorporation (n=20). (C) DNA content as a function of HA incorporation (n=3). (D) Representative brightfield images of live spheroids containing 0.1–1.5 mg/mL of HA after 48 hours in the microwells. Scale bar represents 500 μm. Groups with different letters are statistically different based on a one-way ANOVA with p<0.05. Data are mean ± standard deviation.

