Figure 2.
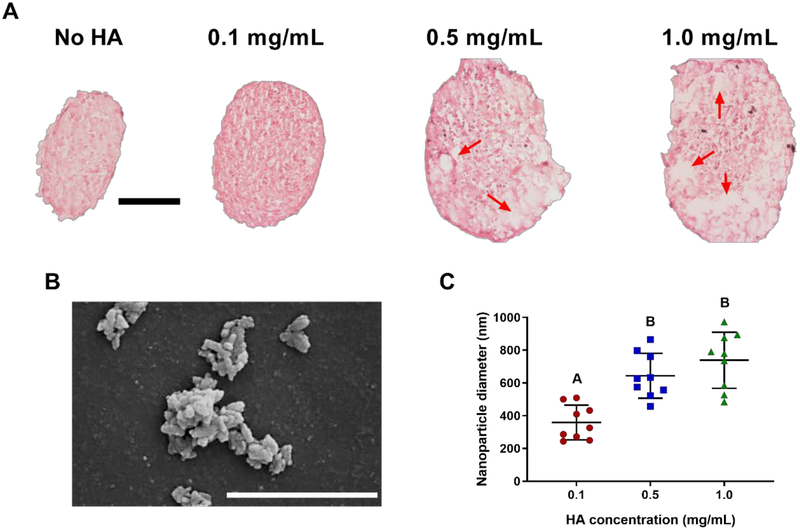
HA distribution within MSC spheroids is dependent on loading concentration. (A) H&E staining of spheroids with varying HA concentrations after 48 hours of spheroid formation. Red arrows indicate voids where HA was present in spheroids. Scale bar represents 100 μm. (B) SEM image of HA immediately before incorporation into spheroids. Magnification is 100,000x; scale bar is 1 μm. (C) Diameter of HA as a function of concentration immediately before incorporation into spheroids (n=9). Groups with different letters are statistically different based on a one-way ANOVA with p<0.05. Data are mean ± standard deviation.

