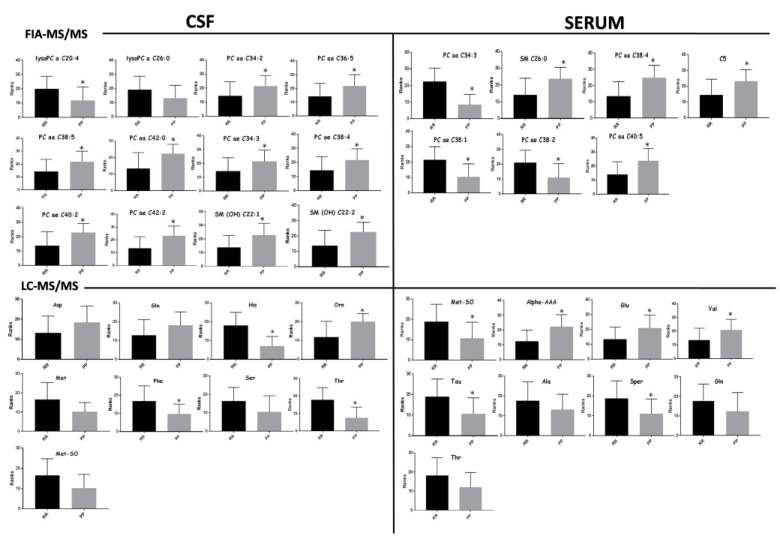
Figure 2.
Univariate analysis. Bar-plot of the most discriminant metabolites resulting from the analysis of CSF and serum analyzed with FIA-MS/MS and LC-MS/MS. The black bar indicates the average concentration of the relapses and remissions (RRMS) class expressed as ranks, while the grey bar indicates the average concentration of the PPMS class expressed as ranks. Stars indicate significant change in the concentration of the metabolites.

