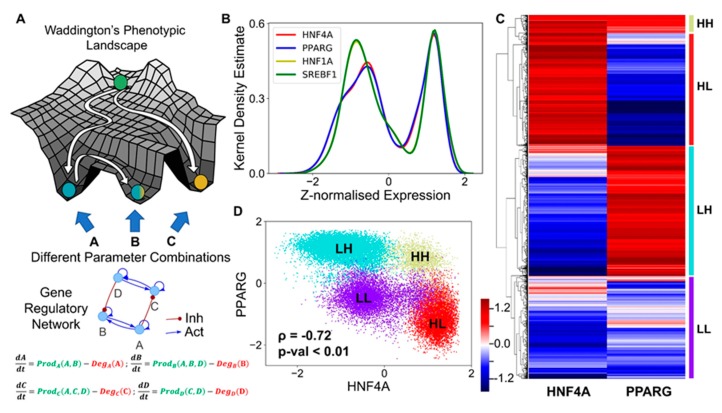
Figure 2.
Core regulatory network may enable multiple phenotypes. (A) Schematic of Waddington’s phenotypic landscape highlighting the possibility of multiple states as a result of the underlying gene regulatory network, the dynamics of which can be modeled by a set of ordinary differential equations representing the interactions among them as shown below. (B) Kernel density plot showing the bimodal distribution of each component of the network, implying that each of the transcription factors (nodes) can exist in either a high (H) or a low (L) state. The x-axis shows the z-normalized log2 expression values of the given component from RACIPE analysis. (C) Heatmap showing the relative levels of HNF4A and PPARG and the resulting four clusters. The color bar represents the relative levels of the individual components (z-normalized log2 expression values). (D) Scatter plot showing the existence of the four distinct clusters (defined based on hierarchical clustering) as the four states based on relative levels of HNF4A and PPARG (z-normalized log2 expression values). Spearman’s correlation was performed to obtain the correlation coefficient (ρ) and the corresponding p-value (p-val).

