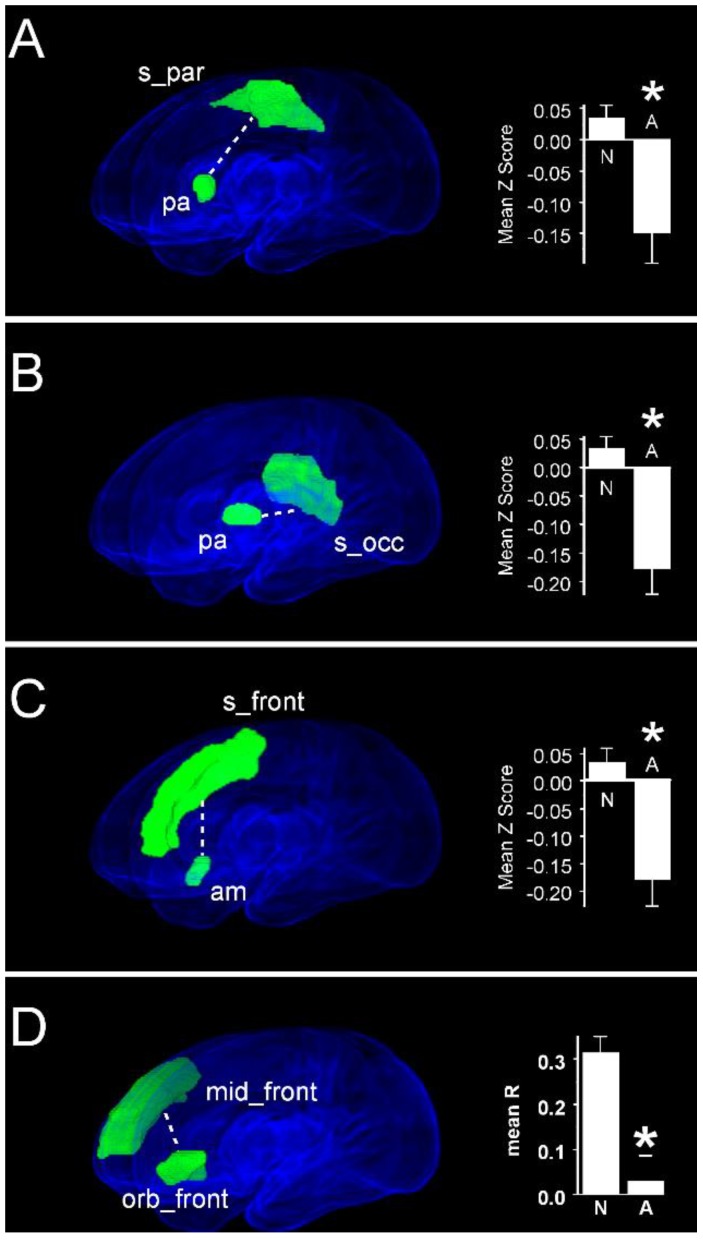
Figure 7.
Region pairs exhibiting increased and decreased functional connectivities in infants with normal scores on the cognitive subscale of the Bayley III assessment at two years post-menstrual age compared with infants with scores <85. Obliquely projected 3D reconstructions of MRI images of cerebral grey matter and identified parcellated regions derived from a neonatal atlas. Dashed white lines depict connectivity relationships. Inset: Fisher-transformed Z-scores ± 1 SEM. (A) Pallidum and superior parietal gyrus. (B) Pallidum and superior occipital gyrus. (C) Amygdala and superior frontal gyrus. (D) Middle frontal cortex ad orbital frontal cortex. N: Normal; A: Abnormal. * PFDR < 0.05.

