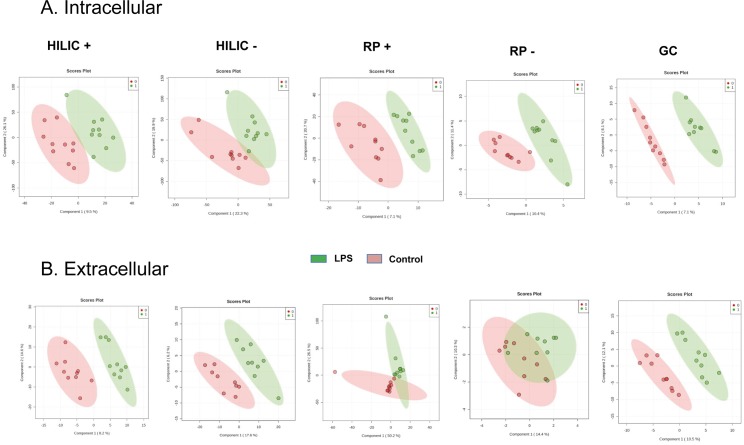
Fig 1. Partial Least Squares—Discriminant Analysis (PLS-DA).
PLS-DA was performed for the intracellular (A) and extracellular (B) HILIC, RP and GC-MS analysis of the human macrophage metabolome (n = 10) in cells cultured for 24 hrs with (green) or without (red) LPS (10 ng.mL-1). HILIC: hydrophilic interaction liquid chromatography; RP: reverse phase; GC: gas chromatography.

