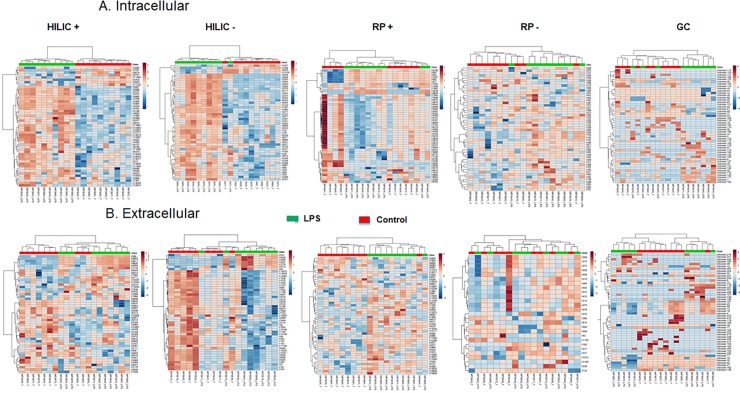
Fig 2. Hierarchical clustering analysis.
The top 50 differentially expressed metabolites for the intracellular (A) and extracellular (B) HILIC, RP and GC-MS analysis of the human macrophage metabolome (n = 10) in cells cultured for 24 hrs with (green) or without (red) LPS (10 ng.mL-1) were used for hierarchical clustering. Metabolites in red are upregulated, those in blue downregulated.

