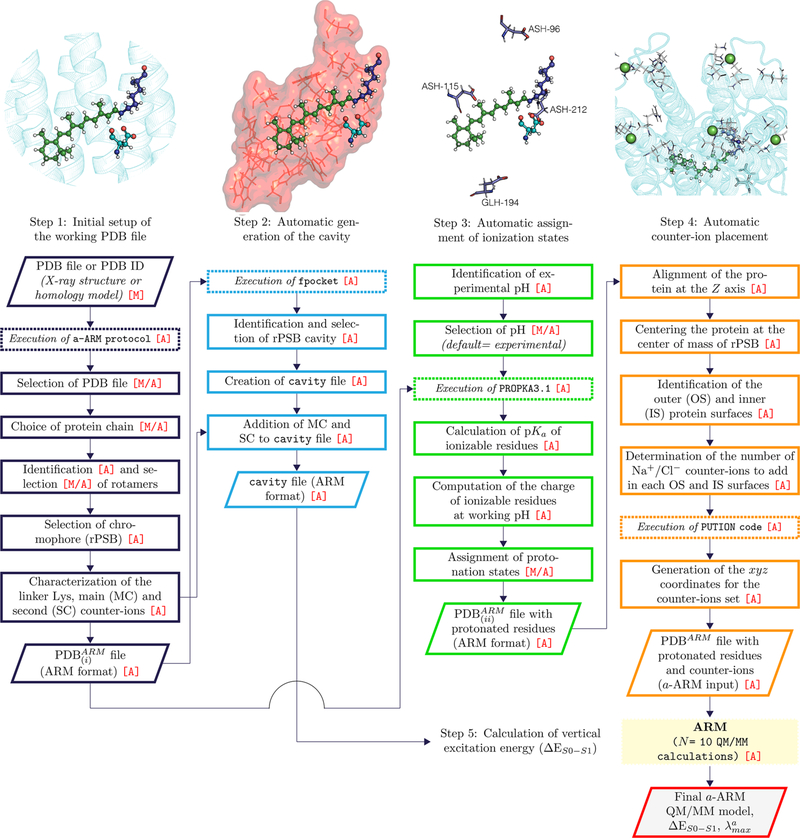
Figure 2.
a-ARM workflow. After the selection of the protein chain, a-ARM generates the ARM input files with complete information on the chromophore cavity, protonation states, and counterion placement (see Figure 1) corresponding to points B–D of section 1. The input is then used for the execution of the original ARM,52 obtaining as output 10 a-ARM models along with the calculated average vertical excitation energy (ΔES1–S0). The parallelograms represent input or output data, the continuous line squares refer to processes or actions, and the dashed lines mean software executions. The [A] mark symbolizes fully automation, whereas the [M] mark represent manual decision. Finally, the [M/A] mark indicates situation that may be either manual or automated (see text). Notice that the software execution labeled “QM/MM calculation” is the same as in the original ARM (see ref 52). In a-ARM the production of the PDBARM and cavity input files takes only a few minutes.

