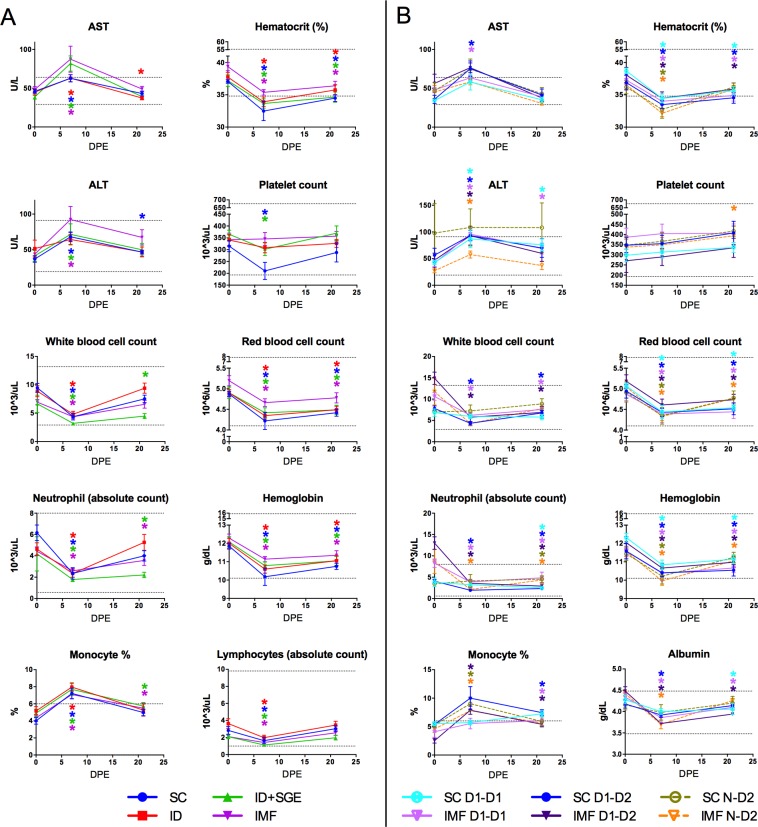
Fig 2. Hematology and clinical chemistries following primary and secondary DENV exposures.
Data were measured on study days 0, 7, and 21 post A) primary DENV-1 infection via different routes/modalities and B) homologous DENV-1 re-exposure, heterologous DENV-2 infection, and primary DENV-2 infection. Analyses were based on an ANOVA model on the change from baseline with the covariates baseline value of the variable and baseline weight and group as factors. n = 10 for each SC, ID+SGE, and IMF; n = 9 for ID; n = 5 for the remainder of groups. (*, p<0.05). SC, subcutaneous; ID, intradermal; ID+SGE, intradermal + salivary gland extract; IMF, infectious mosquito feeding; D1-D1, homologous DENV-1; D1-D2, heterologous DENV-2; N-D2, primary DENV-2.

