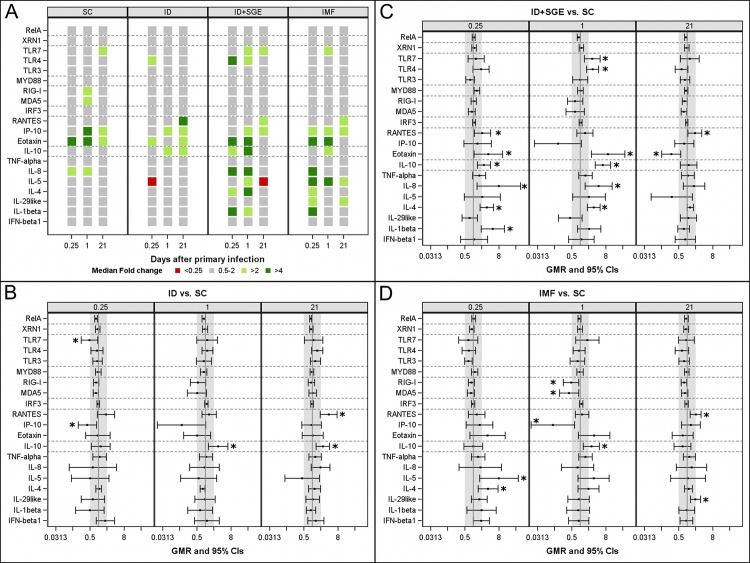
Fig 3. Transcriptional analysis following primary DENV-1 infection in administration sites of skin.
Skin biopsies from DENV-1 administration sites were collected immediately prior to administration (0h), and at 6 hours, 24 hours, and 21 days later. A) Heat map of median fold changes from baseline (0h) by group and time point for each gene. B), C), and D) display geometric mean ratios with 95% confidence intervals of ID, ID+SGE, and IMF groups, respectively, relative to the SC group. Vertical grey bands indicate the 2-fold cutoff region on either side of 1 (no change). Analyses of transcriptional data were based on fold change from baseline derived from the ΔΔCt method. To compare each group to the SC group, an ANOVA model was fitted on log2 fold changes by including group, time, and group*time as fixed effects. Time was considered as a repeated factor with an unstructured matrix and heterogeneous variances between groups were assumed. Geometric means and geometric mean ratios and their respective 95% CIs were derived from this model. No adjustment for multiplicity was performed. n = 10 for each SC, ID+SGE, and IMF; n = 9 for ID. (*, p<0.05). SC, subcutaneous; ID, intradermal; ID+SGE, intradermal + salivary gland extract; IMF, infectious mosquito feeding.

