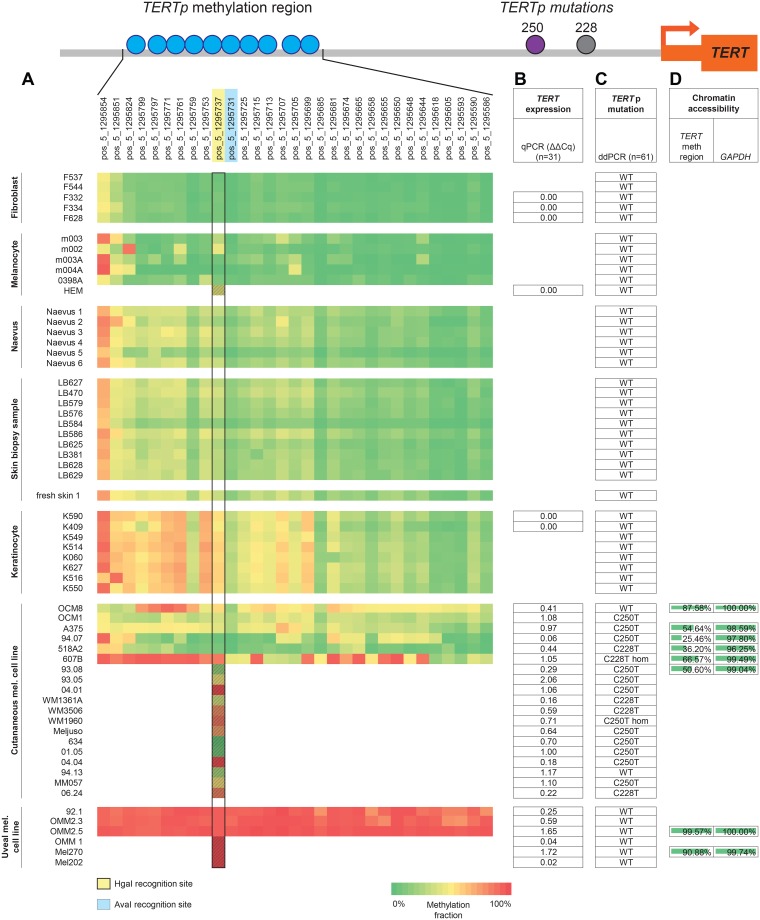
Fig 7. Results overview.
Schematic representation of TERTp with the relative positions of cg11625005 (position 1,295,737 in hg19) to the TERTp mutations (position 1,295,228 and 1,295,250) and the transcription start site (TSS). A. Heat-map of methylation fraction (MF) in 31 CpG sites (top) in 44 samples (left). Yellow-marked CpG cg11625005 (position 1,295,737) is recognised by MSRE HgaI. Blue-marked CpG in 1,295,731 is recognised by MSRE AvaI. Black rectangle: MF at the cg11625005 measured either by NGS (clear squares, n = 44) and by ddPCR (patterned squares, n = 17; these samples were not included in the 44-sample batch subjected to NGS). B. TERT mRNA expression in 31 samples by qPCR analysed through the ΔΔCT method in Bio-Rad CFX manager software (version 3.1, Bio-Rad). C. TERTp mutations evaluated through ddPCR with commercial TERT C250T and C228T Mutation Assays in total 61 samples. D. Analysis of the chromatin accessibility in 8 cultured cell lines for TERT methylation region using GAPDH as a positive control.

