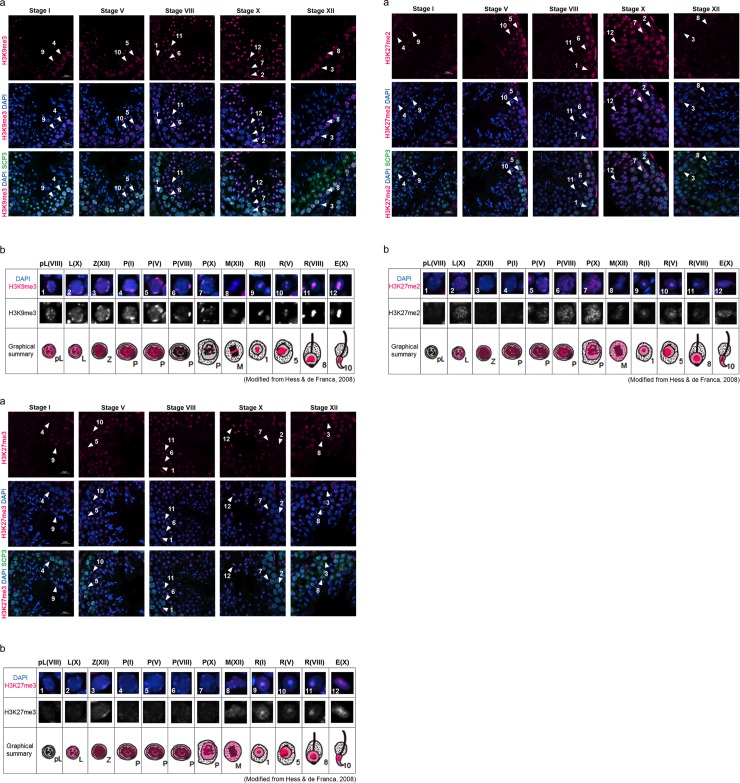
Fig 2. Localization of H3K9me3 (2–1), H3K27me2 (2–2) and H3K27me3 (2–3) in male germline cells in the young (3 M) testis.
(a) Representative confocal images of histone marks (magenta) and SCP3 (green) in the seminiferous epithelium at stages I, V, VIII, X and XII. Nuclei were counterstained with DAPI (blue). The numbers with an arrowhead indicate individual cells at specific stages during spermatogenesis, as shown in Table 2. Scale bar: 20 μm. (b) Magnified images of the cells indicated by arrowheads in (a), and subcellular localization of each histone modification in the young testis is shown in magenta in a graphical summary. The upper panels are merged images of histone marks (magenta) and DAPI (blue), and the lower panels are grayscale images showing the histone marks. Each parenthesis represents the stage of spermatogenesis (see Table 2.).

