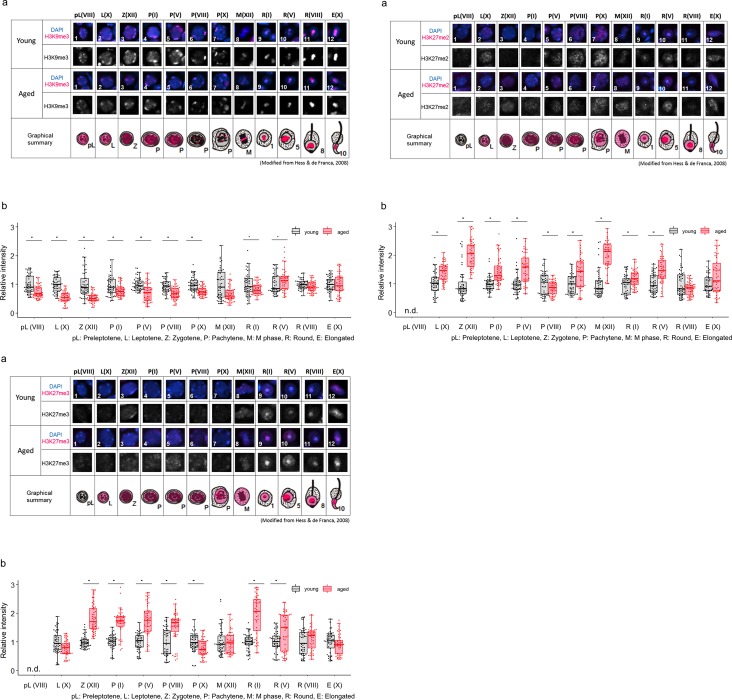
Fig 4. Comparison of localization patterns and intensity of H3K9me3 (4–1), H3K27me2 (4–2) and H3K27me3 (4–3) in male germline cells in young (3M) and aged (12M) testes.
(a) Representative confocal images of histone marks in male germline cells in young and aged testes. In each group, the upper panels are merged images of histone marks (magenta) and DAPI (blue), and the lower panels show grayscale images for histone marks. An illustrated overview shows subcellular localization of each histone modification (magenta) in male germline cells in young and aged testes. The numbers indicate individual cells at specific stages during spermatogenesis, as shown in Table 2. (b) Semiquantitative analysis of histone marks in male germline cells in young and aged testes. Gray boxes show the intensity of aged cells relative to young cells (**p < 0.01, *p < 0.05, n.d., not detected). Black and red dots show relative intensity of individual cells from young and aged testes, respectively. Each number in parenthesis represents the stage of spermatogenesis (see Table 2.).

