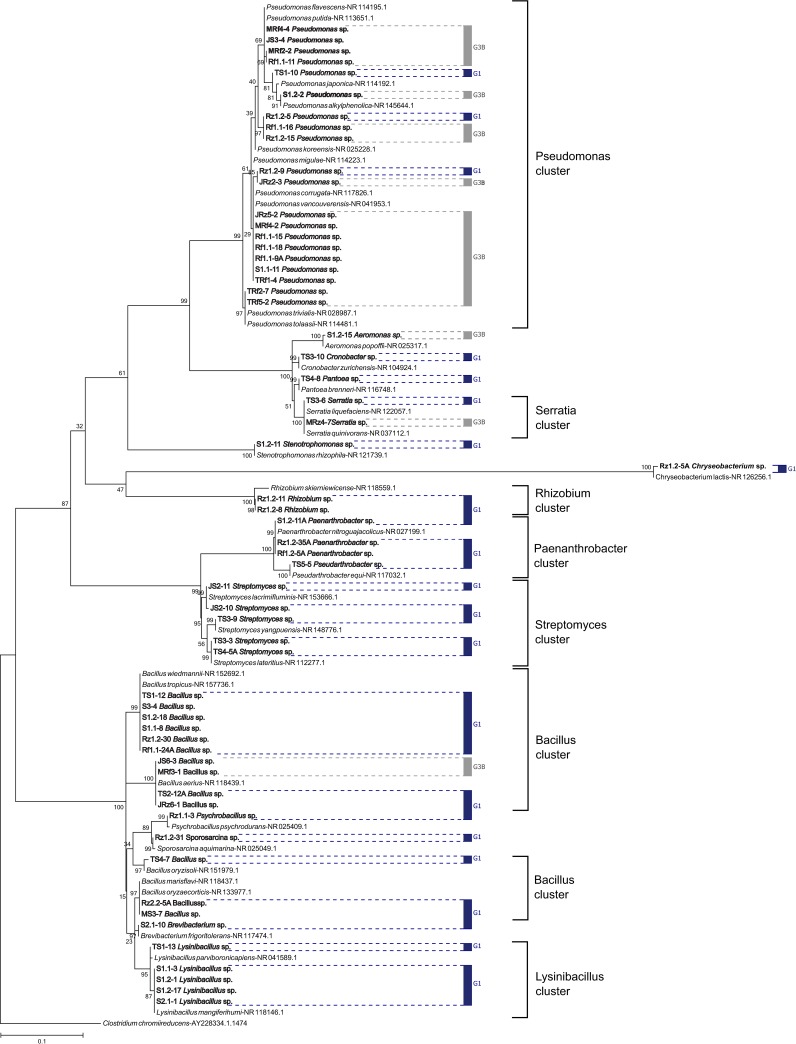
Fig 2. Phylogenetic relationships among G1 and G3B strains, including NCHB references, were inferred using the maximum likelihood method.
The percentage of the replicate trees in which the associated taxa clustered together in the bootstrap test (1,000 runs) is shown next to the branches. The tree is drawn to scale. G1 is indicated with blue lines, and G3B is indicated with gray lines.

