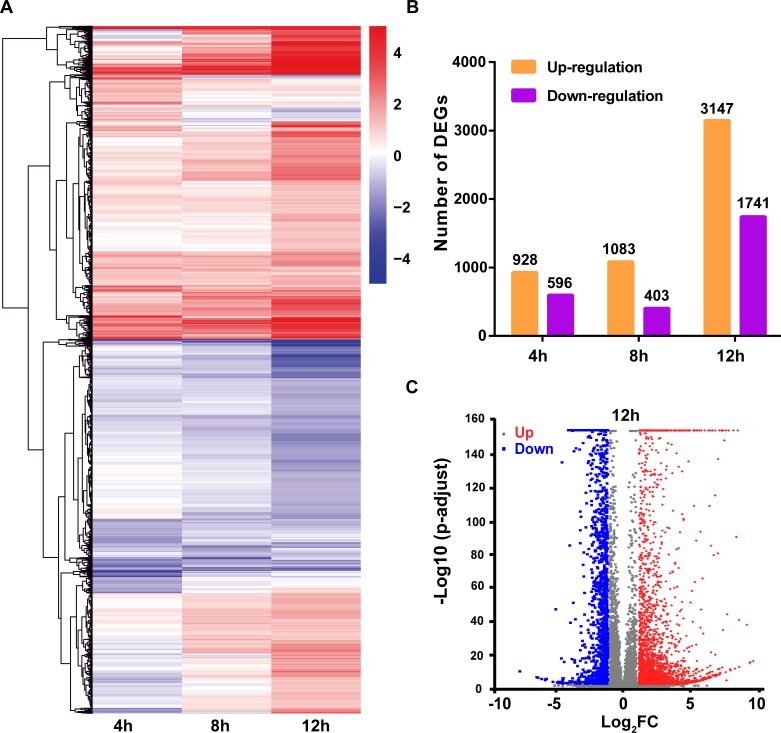
Fig 2. Global analysis of the differential expressed genes (DEGs) upon B-SH virus infection.
(A) A549 cells were infected with B-SH virus (MOI = 0.1), and total RNA was extracted at different time points after infection for RNA-seq analysis. The heat map shows the relative gene-expression levels, with red for high levels expression and blue for low levels expression (log2 scale, from -4 to +4). (B) The number of DEGs at different infection time points. Shades of yellow and purple represent up-regulated and down-regulated DEGs, respectively. (C) Volcano diagram of DEGs between the NC-12 h and B-SH-12 h samples. The horizontal axis indicates expression changes of the DEGs, and the vertical axis indicates statistical test value of gene expression change differences (-log10 p-adjusted). Splashes indicate different specific genes, among which red dots show significantly up-regulated genes, and the blue dots show down-regulated genes.

