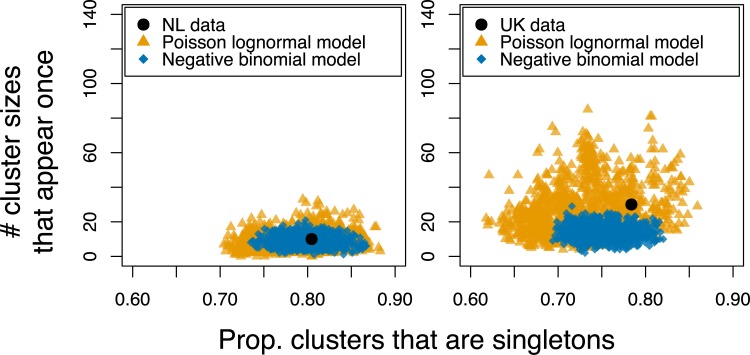
Fig 2. The number of clusters of size 1 (i.e. unmatched cases) against the number of cluster sizes that appear exactly once.
The coloured points are 1,000 model replicates selected from the posterior distributions for the branching process model with the distribution of secondary infections following either a Poisson lognormal distribution (yellow triangles) or a negative binomial distribution (blue diamonds). The black points indicate the data values for the NL (left) and the UK (right).

