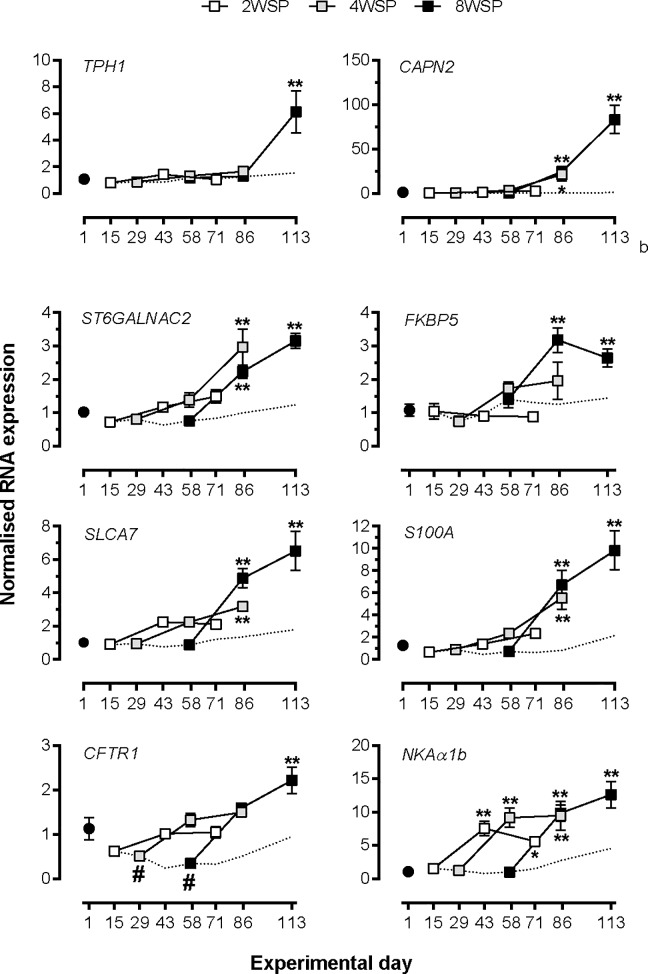
Fig 4. qPCR profiling of effect of SP exposure duration on selected cluster 3 genes.
Data are normalized mRNA abundance, mean ± SEM of n = 6 fish per sampling point. *, ** significantly higher expression than LL and SP values at the corresponding time point, p<0.05, 0.01, respectively; # significantly lower expression than at day 1, p<0.05. Where error bars do not appear, errors lie within the symbol. The dashed line represents the SP control group.

