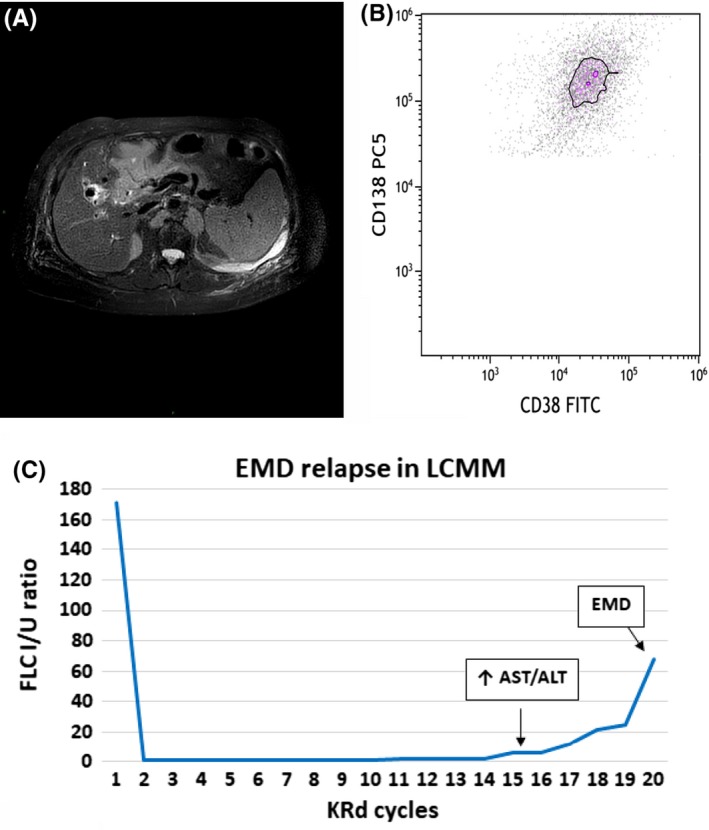
Figure 3.

Clinical course of LCMM patient showing FLC ratio, diagnostic and immunophenotypic images. A, Axial T2‐weighted fat saturation sequences MRI scan of cholangio‐EMD with hepato‐hylar growth and portal infiltration. B, Dot plot shows the presence of plasma cells CD38 + CD138+, evaluated in cytometry, in extramedullary site. C, FLC curve in LCMM patient with EMD relapse during KRd therapy (LCMM—light chain multiple myeloma; FLC I/U ratio—free light chain involved/uninvolved ratio (n.v. 0.31‐1.56); KRd—carfilzomib, lenalidomide, dexamethasone; AST—aspartate aminotransferase; ALT—alanine aminotransferase; EMD—extramedullary myeloma disease
