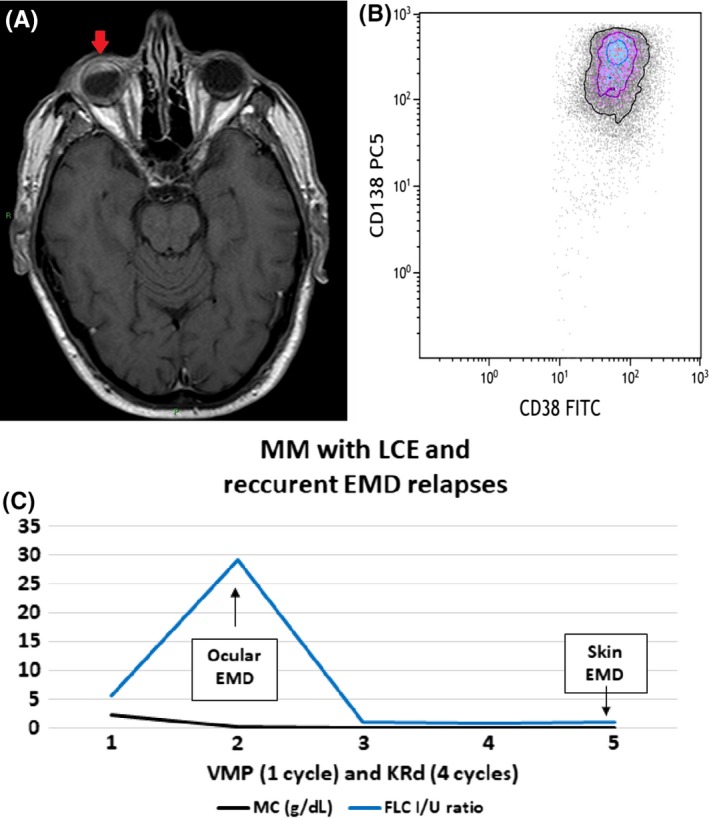
Figure 4.

Clinical course of MM patient with LCE and recurrent EMD relapses showing FLC ratio, diagnostic and immunophenotypic images. A, Axial T1‐weighted spin‐echo postgadolinium MRI scan of ocular EMD infiltration. B, Dot plot shows the presence of plasma cells CD38 + CD138+, evaluated in cytometry, in extramedullary site. C, FLC curve in MM patient with LCE and recurrent EMD relapses during therapy (LCE—light chaine scape; FLC I/U ratio—free light chain involved/uninvolved ratio (n.v. 0.31‐1.56); MC—monoclonal component; VMP—bortezomib, melphalan, prednisone; KRd—carfilzomib, lenalidomide, dexamethasone; EMD—extramedullary myeloma disease)
